0
Currency & Commodity Analysis:
US Dollar Index
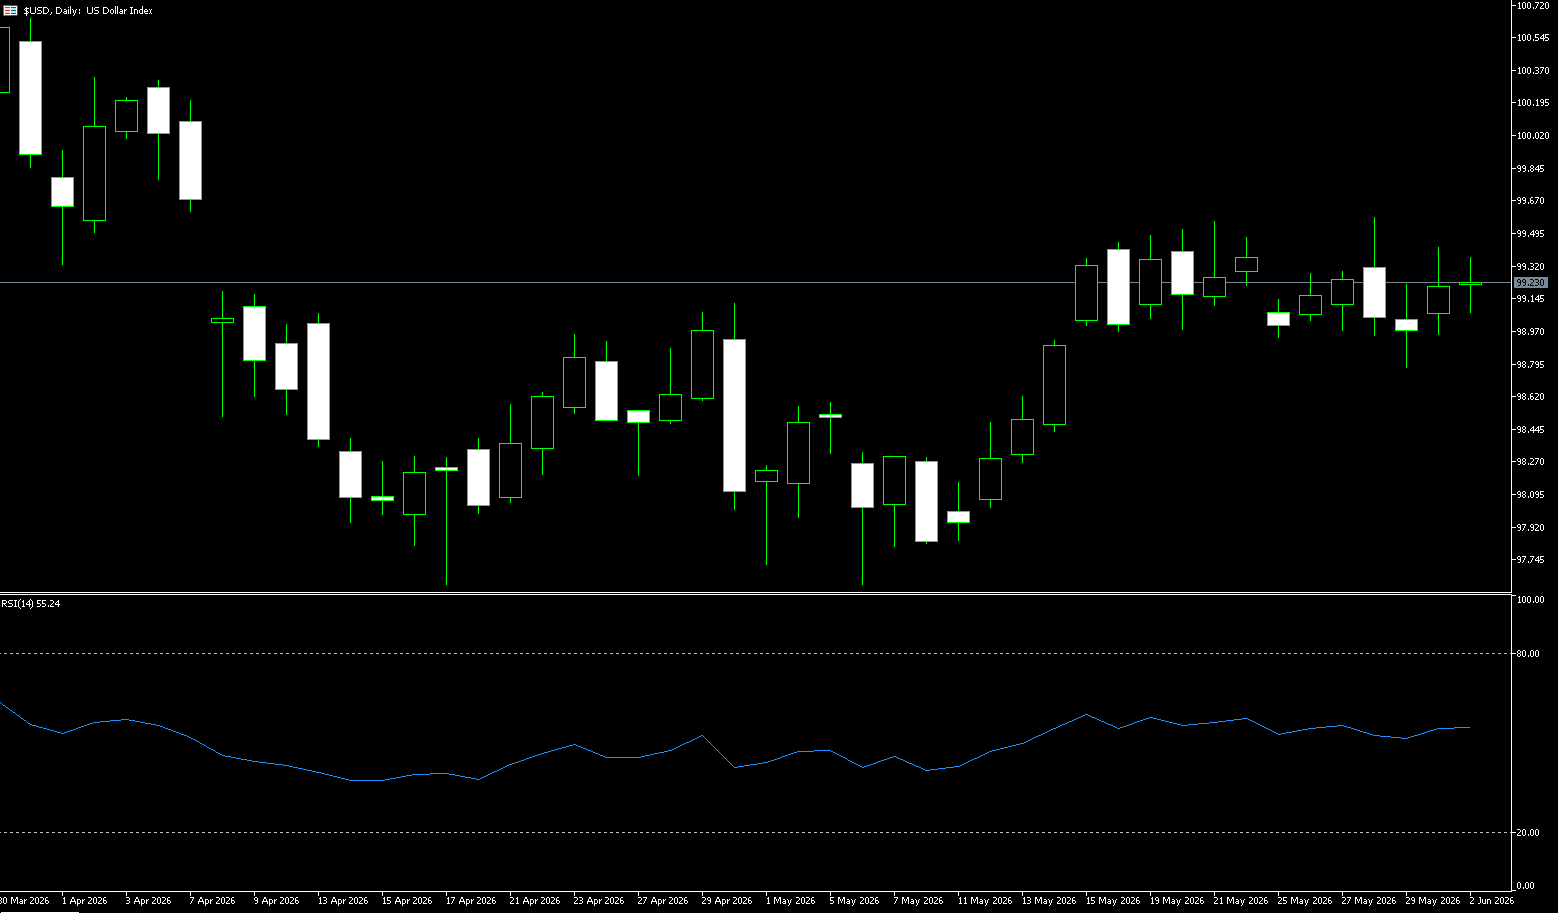
The US dollar index remained above 99 on Tuesday, after rising in the previous session, as stalled US-Iran peace talks increased safe-haven demand, while inflation risks and interest rate expectations came into focus. On Monday, Iranian media reported that Tehran had suspended communication with Washington in response to Israeli attacks in Lebanon. Meanwhile, President Trump stated that discussions are ongoing and hinted that a memorandum of understanding with Iran on reopening the Strait of Hormuz could be reached next week. However, rising energy-driven inflation has led markets to anticipate a possible Federal Reserve rate hike before the end of the year. Investors are now awaiting Tuesday's Jolts job openings report, followed by Friday's closely watched US monthly employment data, for further insight into the Fed's policy outlook.
The US dollar index will be under pressure. The dollar index faces greater downside risk, with 98.79 (the Bollinger Band middle line) and 98.58 (the 200-day moving average) serving as key short-term support levels. A break below these levels could lead to a move towards 97.62 for support. From a cross-market technical perspective, the dollar index and US Treasury yields are currently showing some divergence. On the 240-minute chart of the dollar index, the price has fallen from the mid-May high of 99.55, currently trading at 99.20. The MACD histogram is -0.0169, with both the DIFF and DEA lines below the zero line and in a bearish divergence, indicating the downtrend has not yet reversed. Support levels to watch are the psychological level of 99.00 and the previous pullback low of 98.75; a break below these levels would target the next support zone at the recent low of 97.62.
Consider shorting the US Dollar Index at 99.30 today, with a stop-loss at 99.40 and targets at 98.70 and 98.80.
WTI Crude Oil
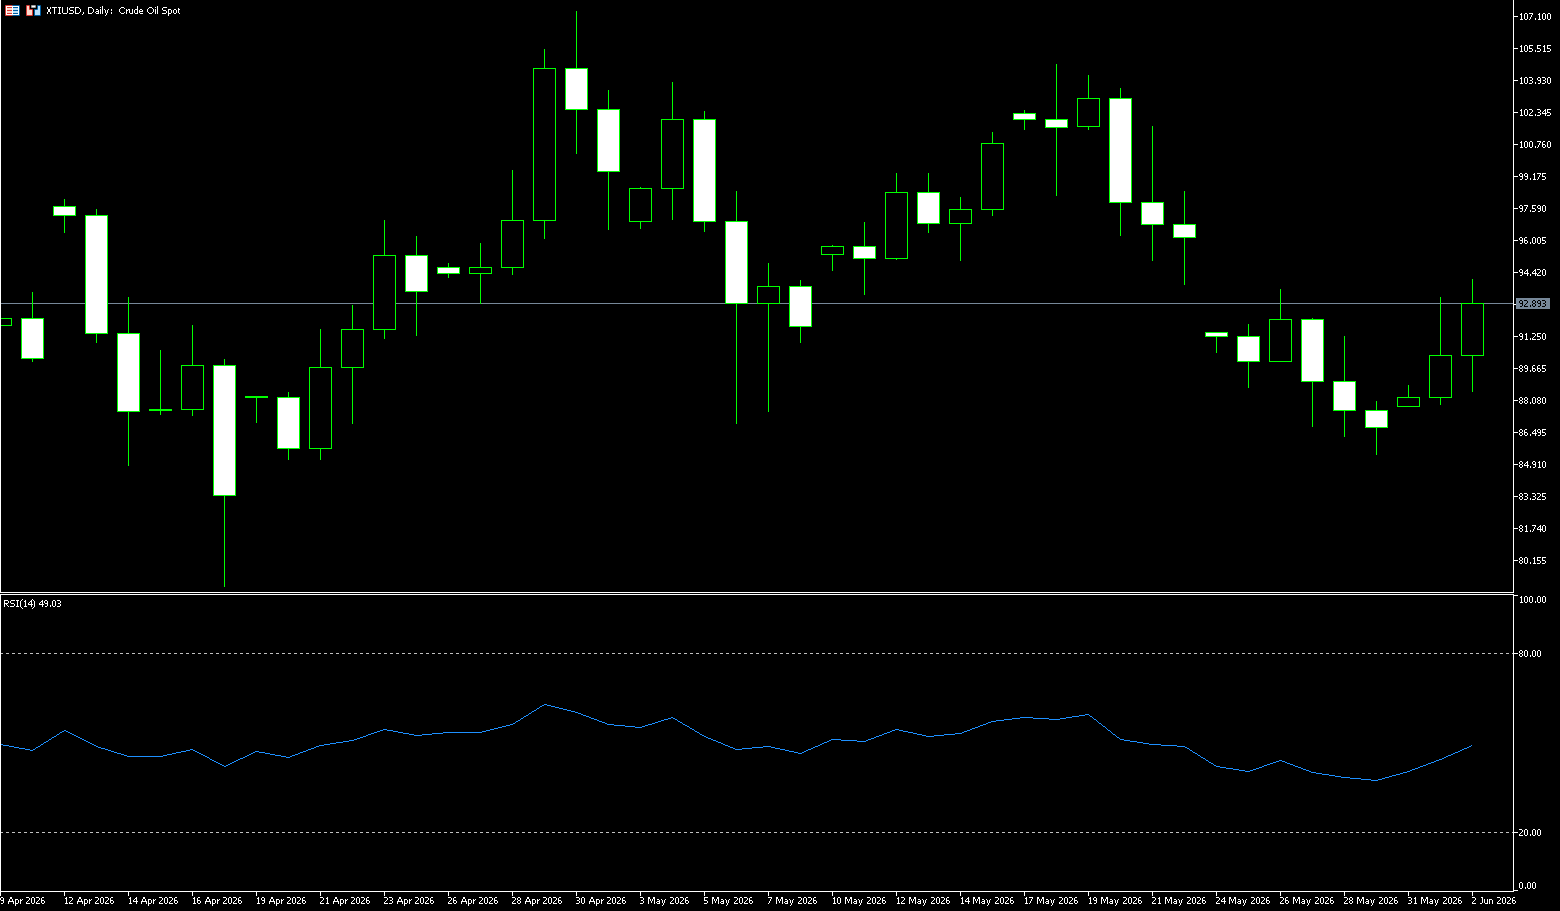
The crude oil market experienced a rare and dramatic rollercoaster ride at the beginning of the week. According to the intraday chart, US crude oil prices suddenly surged, with a significant initial rise; followed by a near-vertical second surge around 22:00 to 00:00 the next day, with the intraday maximum increase approaching 8%, reaching a high of nearly $93. This dramatic fluctuation today is essentially an episode in the US-Iran nuclear talks, not a fundamental reversal of strategic direction. The willingness and underlying motivation for both sides to continue negotiations remain: Iran urgently needs the lifting of sanctions, the reopening of ports, and the alleviation of domestic economic pressure; the US hopes to use diplomatic achievements to lower oil prices, stabilize the global energy market, and fulfill political commitments. This structural interest remains unchanged. In the coming days, the market will continue to focus on subsequent statements from all parties, ceasefire progress, and actual military developments. Amidst the repeated tug-of-war between geopolitical games and supply and demand realities, the high volatility of the crude oil market will persist, and rationality, caution, and risk control remain the best approach.
From a technical perspective, crude oil prices are currently still trading below two upward trend lines. The recent rebound, characterized by a small-bodied bullish candlestick, is not a signal of a strong upward attack, but rather more like short covering and profit-taking after the previous sharp decline. The lack of short-term buying power is clearly reflected in the price structure. Analyzing using the Fibonacci retracement system, this rebound has precisely touched the 23.6% Fibonacci level of the previous downward wave. After reaching this range, the upward momentum has weakened. If the rebound continues upward, the bulls may lack the strength to launch a sustained attack, and the levels of 93.17 (the early weekly high) and the 38.2% Fibonacci level of 93.86 will be difficult to break. Looking at key support levels, if the market ends its current rebound and returns to a downward channel, the first key level to watch is $90.00 (a psychological level), which is the first crucial support. Once this level is effectively broken, the downside potential will open up further, with the next important target at $88.86 (the 5-day moving average).
Today, consider going long on crude oil at $91.85, with a stop-loss at $91.68 and targets at $93.50 and $94.00.
Spot Gold
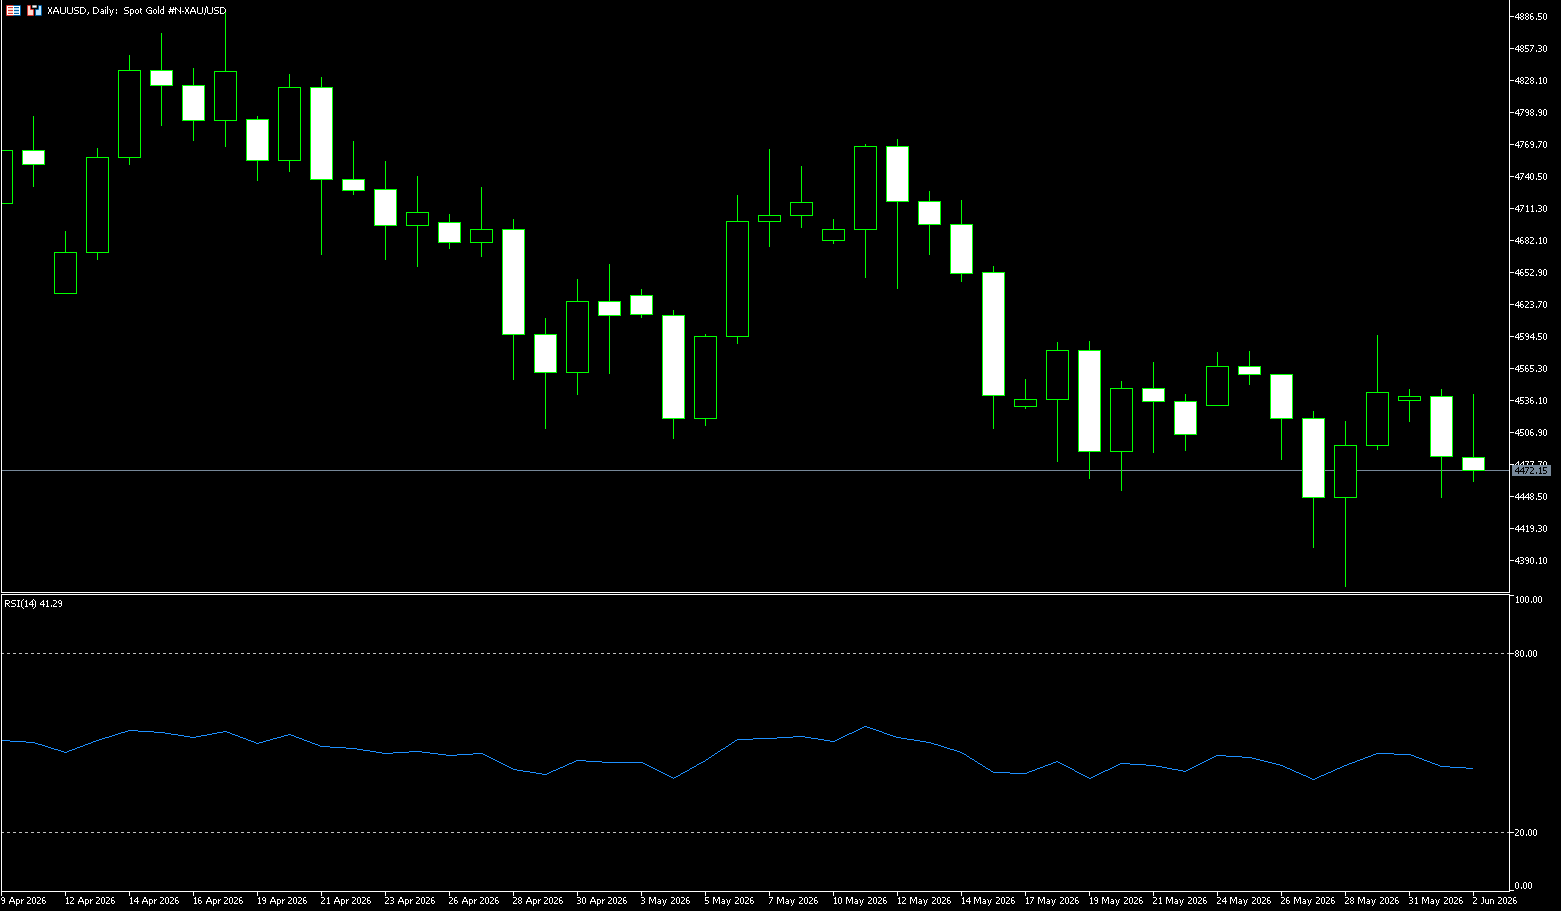
At the beginning of this week, spot gold fell nearly 2% to $4,447.70 per ounce, mainly due to strong US manufacturing data boosting the dollar and escalating tensions in the Middle East leading to a surge in oil prices and reinforcing expectations of interest rate hikes. Subsequently, Trump stated that Hezbollah and Israel had agreed not to attack each other, and gold prices rebounded to around $4,485 in Asian trading on Tuesday. The market is closely watching the developments in the Middle East and Friday's non-farm payroll report. Multiple factors are at play behind this decline. On the one hand, the latest US ISM Manufacturing Purchasing Managers' Index for May was very strong, boosting the US dollar exchange rate and putting direct pressure on dollar-denominated gold. On the other hand, geopolitical tensions in the Middle East escalated again over the past weekend: news of these escalating conflicts significantly increased market concerns about geopolitical risks, pushing international oil prices up by more than 8%, reaching a new high in nearly a week. The sharp rise in oil prices further exacerbated market concerns about the inflation outlook and strengthened investors' expectations that the Federal Reserve may continue to raise interest rates. These factors combined to suppress gold prices.
From the daily chart, spot gold is trading below the Bollinger Band middle line {$4580}. The current price is clearly in the lower half of the band. After the recent high of $4,773.37 {the high on May 12} failed to hold, gold prices gradually retreated, with the previous low of $4,366.50 remaining a key level for the market. On the MACD front, the DIF is around -49.85, the DEA around -47.63, and the histogram around -4.44, indicating that momentum has not yet fully recovered. More importantly, the price action has narrowed, with gold repeatedly testing the $4,500 level but failing to break away effectively. On the downside, the short-term focus is on the $4,450 pivot area near the current price, followed by strong support at $4,425. If selling pressure intensifies, the 200-day simple moving average near $4,411 will act as a deeper structural support level. On the upside, initial resistance is near the week's high of $4,546, followed by the 20-day simple moving average at $4,580, and then the $4,600 level.
Today, consider going long on gold at $4,485, with a stop-loss at $4,480 and targets at $4,530 and $4,540.
AUD/USD
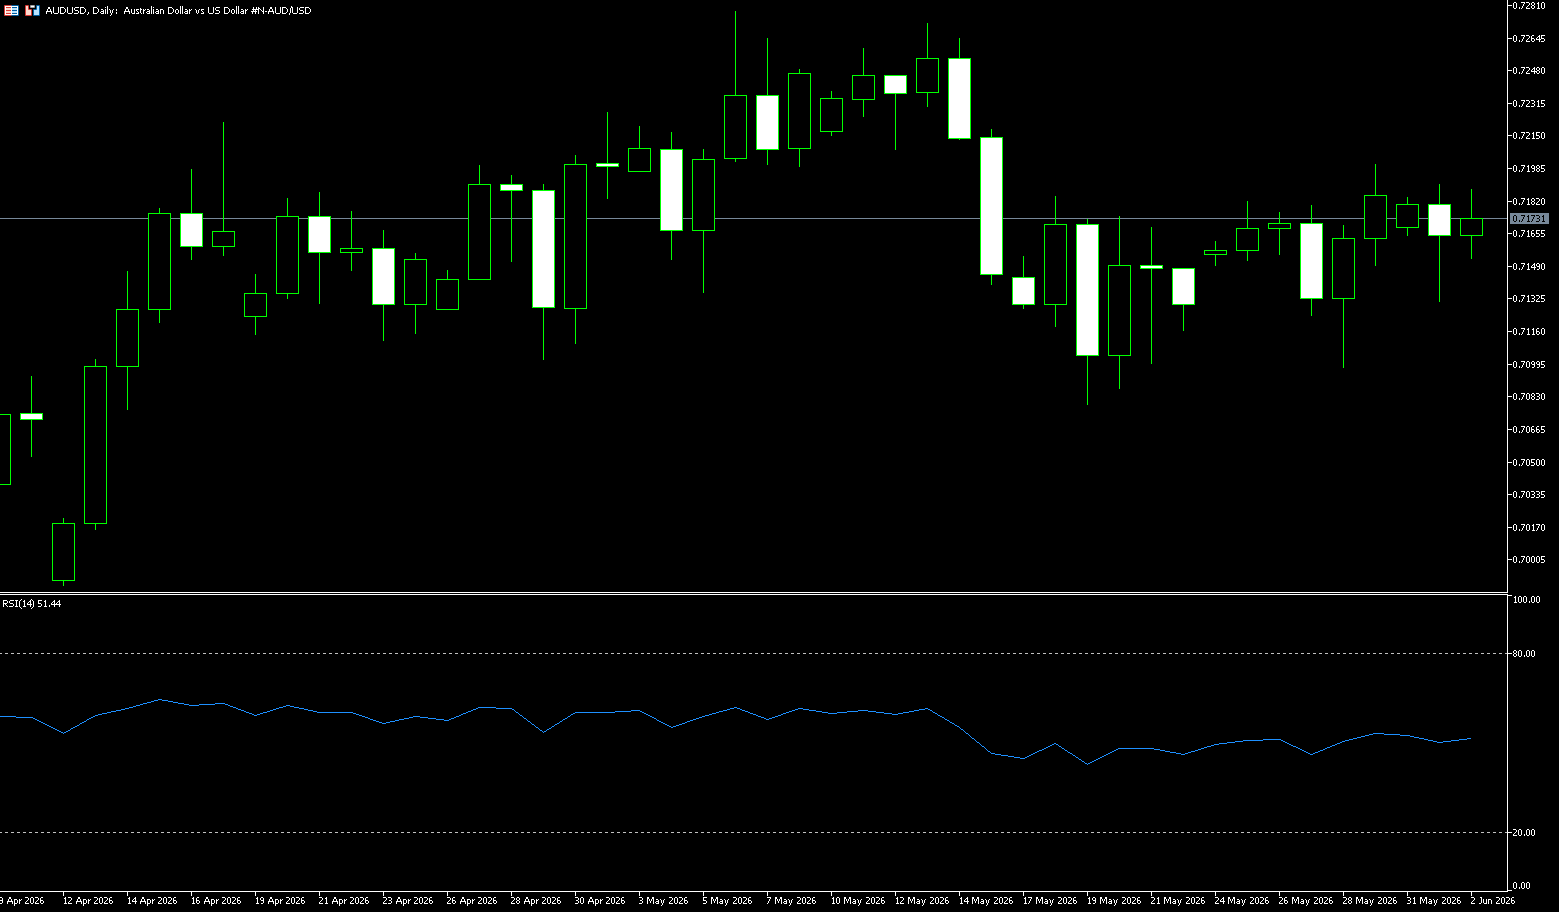
During Tuesday's Asian trading session, the Australian dollar fell to around 0.7170 under pressure from heightened geopolitical uncertainty. Traders are focused on progress on the Middle East ceasefire and key economic data from Australia and the United States. Australia's first-quarter GDP report will be released on Wednesday. US May non-farm payroll data will be the focus of the market on Friday. Reserve Bank of Australia Governor Ian Harper said on Tuesday that the persistence of inflation remains a major concern. Harper further noted that rising indicators of market inflation expectations are causing concern. Iranian state media reported on Monday that Tehran has suspended negotiations regarding Israel's actions in Lebanon. According to another report, US President Donald Trump stated that he believes an agreement to reopen the Strait of Hormuz and extend the ceasefire with Iran can be reached "within the next week." Any sign of escalating tensions in the Middle East could weaken risk assets, such as the Australian dollar against the US dollar.
On the daily chart, the Australian dollar is trading at 0.7170 against the US dollar, maintaining a slightly bullish bias as it remains above key moving averages. The 50-day moving average is at 0.7113, and the 100-day simple moving average is at 0.7057, both below the current price, indicating that the underlying trend remains constructive despite recent consolidation. Momentum is weak, with the Relative Strength Index (RSI) hovering around neutral 50 and the Average Directional Index (ADX) around 17, suggesting that directional confidence remains cautious. On the upside, short-term resistance lies at the four-year high reached earlier in May, with the 0.7300 level forming tight resistance; a sustained break above this area would pave the way for the next key resistance at 0.7400. Initial support is seen at the 50-day simple moving average (SMA) at 0.7113 and reinforced by the slightly lower 100-day SMA at 0.7057, while deeper support lies at the 0.7000 level (a psychological level).
Consider going long on the Australian dollar today at 0.7165, with a stop-loss at 0.7153 and targets at 0.7220 and 0.7210.
GBP/USD
GBP/USD traded in positive territory around 1.3450 during Tuesday's European session. However, renewed tensions in the Middle East may limit upside for the major currency pair, with reports that Iran has withdrawn from negotiations with the United States. Traders will be closely watching the latest developments in Middle East peace talks. Iranian state media reported on Monday that Tehran had suspended negotiations on Israel's actions in Lebanon. Separately, US President Donald Trump reportedly stated that he believes an agreement to reopen the Strait of Hormuz and extend the ceasefire with Iran can be reached "within the next week." Mixed signals and uncertainty in the Middle East could boost safe-haven currencies like the US dollar, putting downward pressure on the major currency pair in the short term. Bank of England Governor Andrew Bailey said on Friday that the Bank of England would not rush to raise interest rates given the uncertainty surrounding the outcome of the Iran war and weak UK economic growth. Reuters reported that currency market futures currently suggest a tightening of 32 basis points this year.
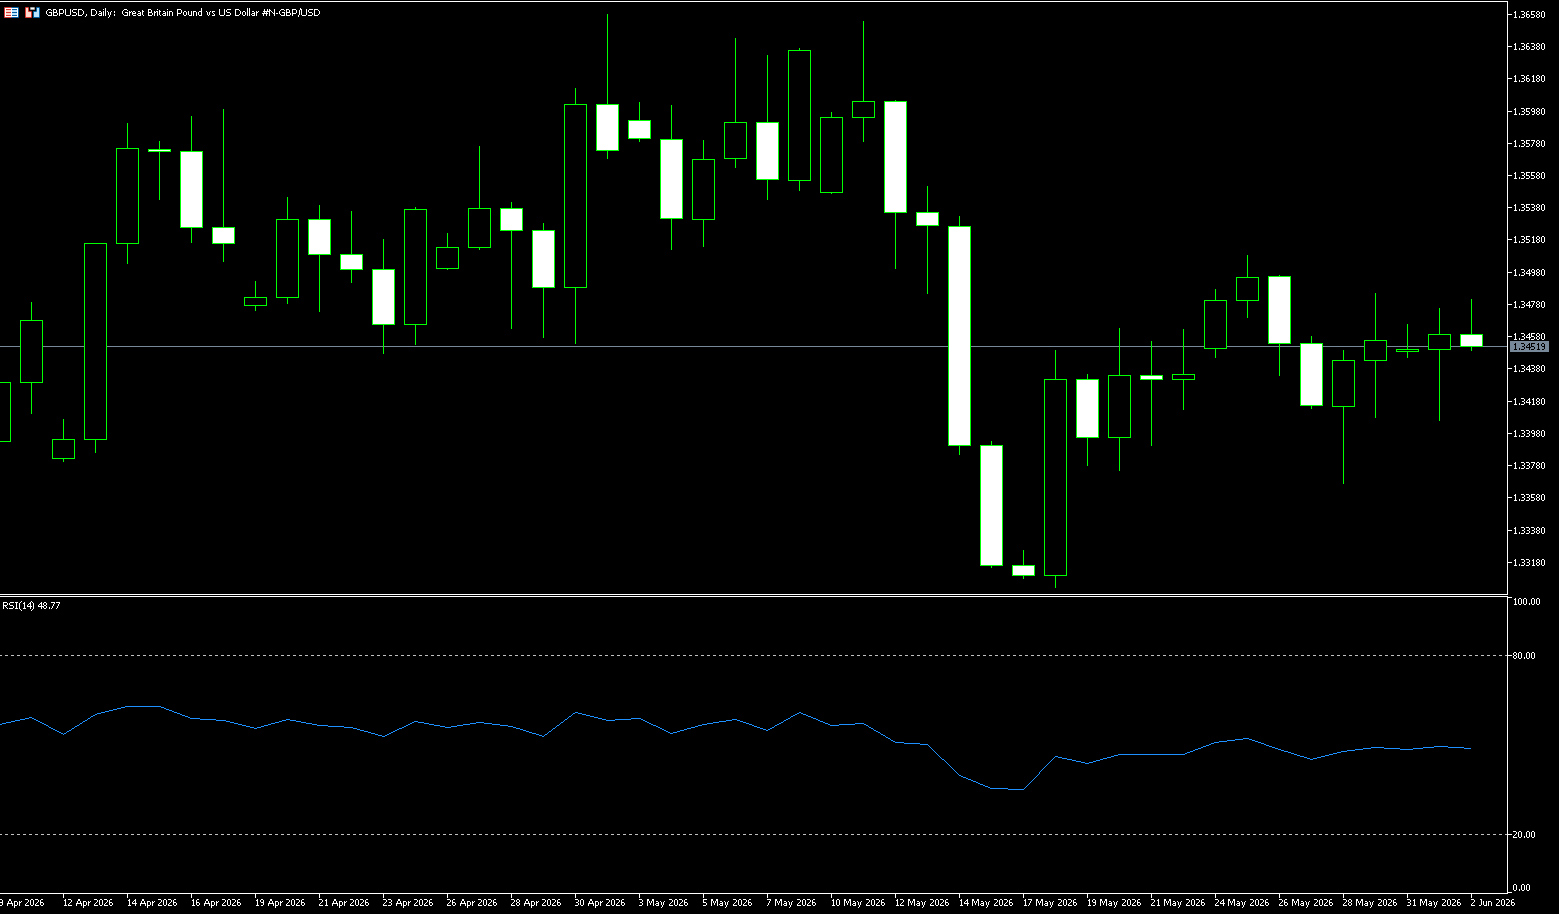
The pound/dollar pair is currently in a wide-range, directionless consolidation phase on the daily chart. The exchange rate fell from its previous high of 1.3867, bottomed at 1.3159, rebounded to 1.3657, and has recently fallen again, currently trading around 1.3450. It is within a densely packed range of multiple moving averages, indicating a stalemate between bulls and bears, with no clear directional trend yet. On the moving average system, the price is oscillating repeatedly around the MA5/10/20/50/100, without forming a clear bullish or bearish alignment. The RSI indicator is around 49, in the neutral range, with no overbought or oversold signals. The MACD's DIFF and DEA lines are converging near the zero axis, with extremely short momentum bars, indicating a near balance between bullish and bearish momentum. Overall, the GBP/USD pair is expected to continue its range-bound trading in the short term. Resistance levels to watch are 1.3500 (a psychological level) and 1.3551 (the high from May 13th). Support lies around the 1.3400 level, with the next level to be determined by 1.3321 (the lower Bollinger Band) to confirm the next direction.
Today, consider going long on GBP at 1.3455, with a stop-loss at 1.3445 and targets at 1.3480 and 1.3490.
USD/JPY
On Tuesday, the USD/JPY exchange rate continued its upward trend, briefly touching 159.95. The yen remained under pressure against the dollar, currently approaching the important psychological level of 160, a level that has repeatedly prompted Japanese government intervention in the foreign exchange market, making it a closely watched warning line. Official data released last Friday confirmed that Japan intervened in the market with 11.7 trillion yen in late April to support its currency. This officially confirmed the large-scale foreign exchange market intervention widely speculated by the market. Now that the exchange rate is approaching the 160 mark again, investors are beginning to analyze whether the Bank of Japan will intervene again. In addition, the latest Japanese corporate investment data fell short of expectations, adding further downward pressure on the yen. Data shows that Japanese corporate capital expenditures saw zero year-on-year growth in the first quarter, reflecting a significant slowdown in domestic corporate investment and raising concerns about the sustainability of Japan's economic growth.
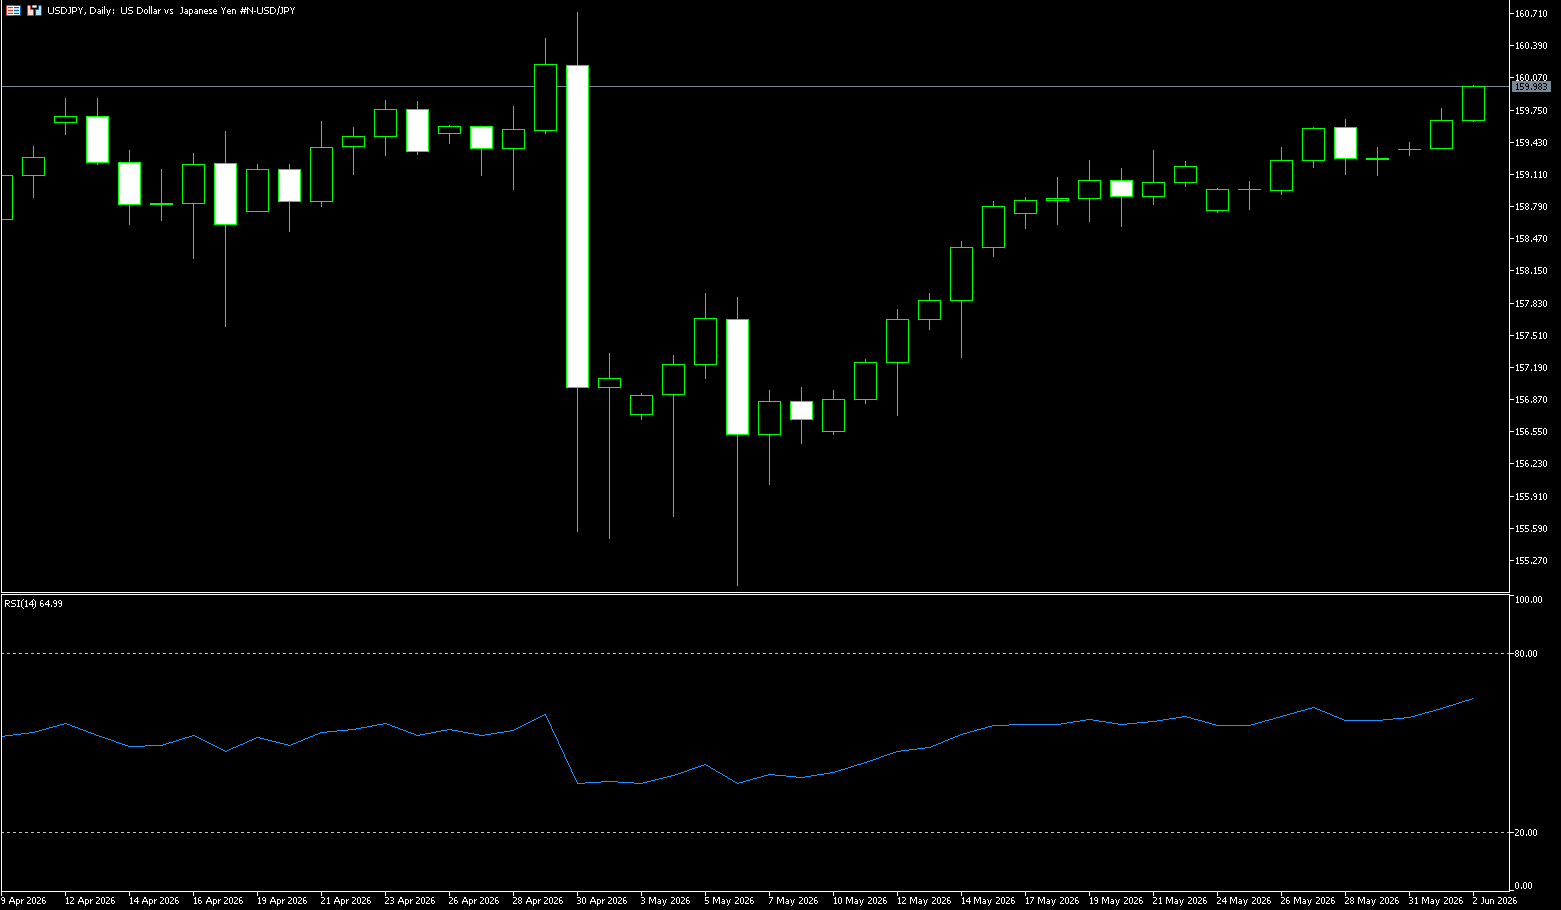
The yen has remained weak due to a combination of factors, including a weak domestic economy in Japan and various global uncertainties, providing solid support for the USD/JPY exchange rate. As the exchange rate approaches the key level of 160, the 4-hour chart shows USD/JPY currently consolidating around 159.00, with the price gradually breaking upwards, targeting 160. Based on the price action, this level is likely to be reached today, after which the price may pull back to around 159.00 for consolidation. The MACD indicator also confirms this assessment, with the signal line above the zero line and maintaining a strong upward trend, indicating further upside potential. A successful break above 160.00 could see the market test 161.50 or even 163.00; conversely, a drop below 159.00 could trigger a correction towards the psychological level of 158.
Today, consider shorting the US dollar at 160.10, with a stop loss at 160.28 and targets at 159.20 and 159.00.
EUR/USD
At the beginning of the week, the Eurozone's overall PMI exceeded expectations but did not trigger a significant reaction in the euro. This is partly due to the dollar's continued reliance on geopolitical factors and partly due to the quality of the Eurozone PMI. Recently, bullish sentiment in the forex market has suffered a severe blow, and the euro has remained under pressure against the dollar. Looking at the global forex market, this underlying economic vulnerability in the Eurozone significantly limits the euro's upside potential. In the short term, the market's attention has turned to the upcoming US non-farm payroll report. Until the fundamental change in the "strong US, weak Euro" macroeconomic landscape, the strong US economic fundamentals will support the Federal Reserve in maintaining high interest rates, while the European Central Bank faces the dual pressure of "controlling inflation" and "maintaining growth." The influx of safe-haven funds into the US dollar, compounded by the Middle East turmoil, coupled with the triple whammy of inflation, supply chain issues, and weak demand, will likely keep the euro under significant downward pressure in the short term.
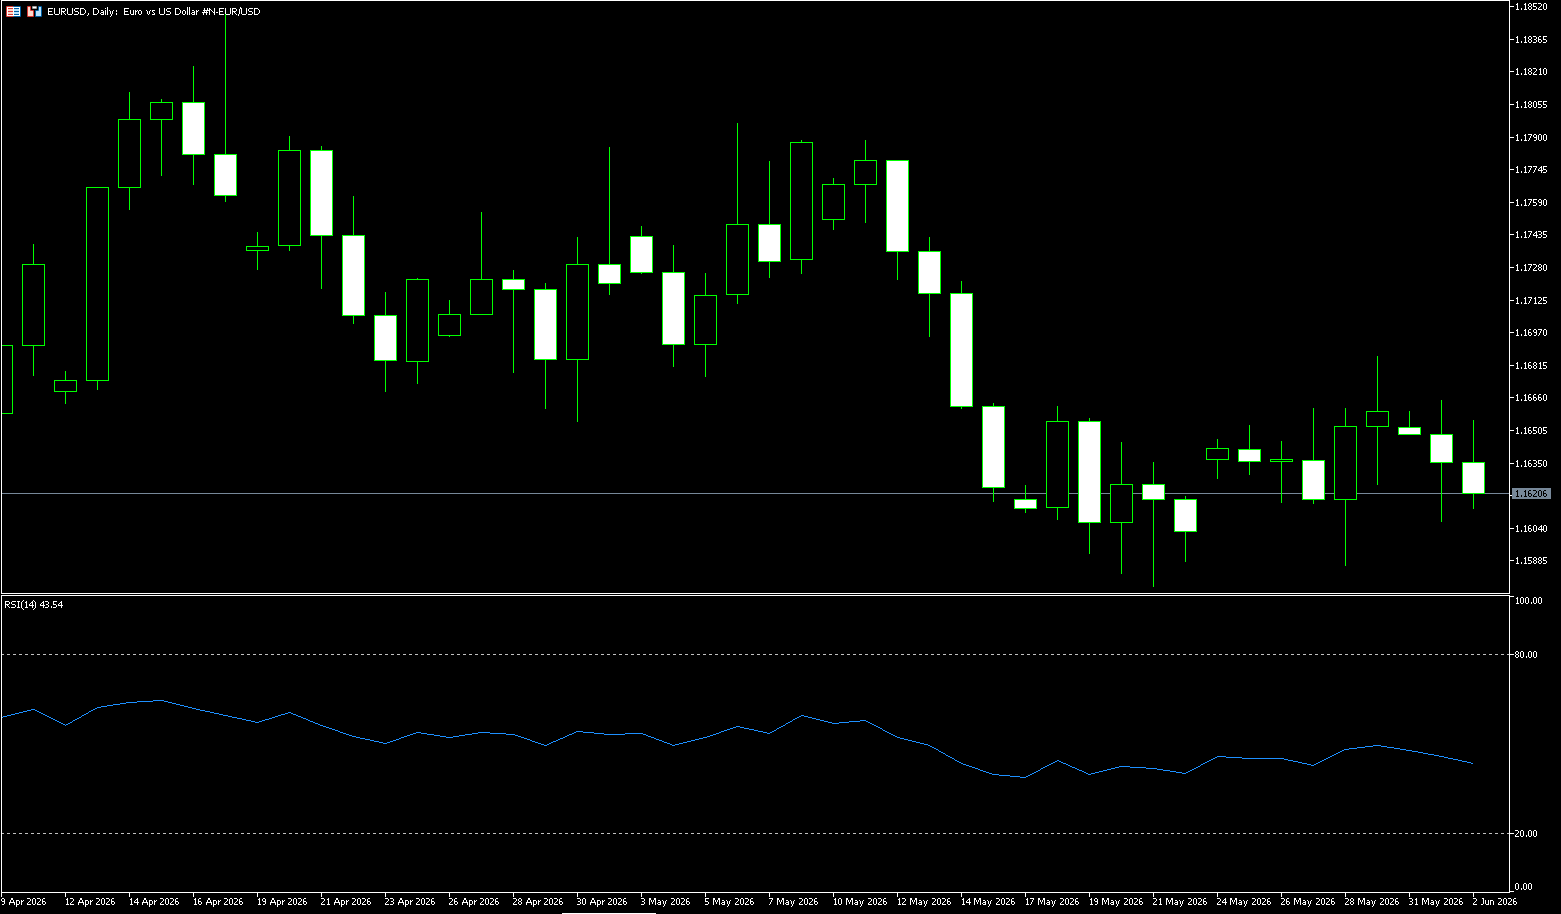
This Friday's US non-farm payroll report will be a key event influencing the dollar and euro's movements. If the job market remains strong, the dollar may gain further upward momentum; conversely, it could drive a temporary rebound in the euro. From the daily chart, the euro/dollar pair maintains its overall medium-term upward structure, but recent upward momentum has clearly slowed. The exchange rate found support at 1.1585 (the low of May 28th) and has rebounded technically, currently trading above the moving average system. The 1.1600 (psychological level) area forms the current key support level, while the 1.1700-1.1750 area forms a significant resistance zone. A break above 1.1750 could lead to a further challenge of the 1.1800 (psychological level) high; a break below 1.1600 could lead to a retest of the 1.1585 support area. The RSI indicator is around 45, indicating that the market remains in a mild bullish pattern. The MACD indicator's red bars continue to shrink, reflecting a weakening of upward momentum.
Today, consider going long on Euro at 1.1618, with a stop loss at 1.1605 and targets at 1.1670 and 1.1660.
Stock Analysis:
Australian ASX 200 Stock Index
Basic Market Overview:
The Australian Securities Exchange (ASX) 200 index closed nearly flat on Tuesday at 8724 points. Early weakness was offset by gains in technology services, healthcare, and non-energy minerals, which recovered losses in retail trade, processing, and financials. Traders are anticipating Wednesday's release of Australia's first-quarter GDP data, seeking clues about the direction of monetary policy at the central bank's meeting later this month. Meanwhile, new data released today showed that Australian business inventories rebounded in the first quarter, after declining in the previous two quarters. However, corporate profits declined during this period after strong growth in the fourth quarter. At the same time, the first-quarter current account deficit hit a record high, falling short of expectations.
Sector Performance:
Leading Gains: Information Technology (+5%) (AI/Software led the gains), Materials (Copper/Lithium), Energy (Oil Price Rebound).
Leading Losers: Healthcare, Real Estate, Financials (Banking).
Outstanding Stocks: Northstar Resources rose 13.6%, Objective Corp (OCL) +9.46% to 11.46 (technology and software), Wisetech Global (WTC) +9.14% to 39.30 (logistics and technology), and Pro Medicus (PME) +8.90% to 144.03 (healthcare and IT).
Technical Analysis:
The ASX200 index is hovering around 8,724 points, exhibiting a typical high-level consolidation pattern with a slight downward bias. It is finding short-term support above the 50-day moving average but is constrained by strong resistance near the 200-day moving average and 8,800. The market is experiencing intense back-and-forth between bulls and bears, with no clear direction, exhibiting a "range-bound trading + waiting for a breakout" technical pattern. The short-term moving average (50-day) is flat or slightly upward, while the long-term moving average (200-day) is slowly declining, showing a converging bearish alignment and clear consolidation characteristics. The RSI (Relative Strength Index) is currently between 48 and 52, indicating a neutral to slightly weak bias with no significant overbought or oversold conditions, and exhibiting significant oscillation characteristics. The MACD histogram is near the zero line, with the fast and slow lines converging, indicating converging momentum and an impending breakout. Regarding market breadth: only 52% of stocks are above the 50-day moving average, and 40% are above the 200-day moving average, showing significant divergence and weak bullish momentum. In terms of volatility, there have been several instances of 100-point swings in the past month (such as the rebound after hitting a low of 8,625 on June 2nd), indicating increased short-term volatility and uncertainty in direction.
Trading Strategy:
The ASX200 is currently consolidating within the 8,255-8,800 range, awaiting peak interest rates and a recovery in Chinese demand before attempting to break above 9,000. If 8,255 is breached, a medium-term decline to 7,960 (the 52-week low) could lead to a significant correction.
Short-term: Buy low and sell high between 8,600 and 8,800; take profits in batches between 8,780 and 8,800; cautiously add positions below 8,600.
Mid-term: Mainly observe; enter only after a firm hold above 8,800; reduce positions to mitigate risk if it falls below 8,500.
Key Risk Warnings:
Global geopolitical conflicts, a slowdown in the Chinese economy, and a rebound in Australian inflation leading to an RBA interest rate hike could all trigger a downward breakout.
Hong Kong Hang Seng Index
Basic Market Overview:
The Hang Seng Index rose 640 points, or 2.52%, to 26,038 on Tuesday, extending gains from the previous trading day, as technology stocks rose on continued optimism regarding investments in artificial intelligence. This followed Wall Street hitting new highs overnight, with major technology stocks performing strongly. However, investor sentiment remained cautious as traders weighed the uncertainty surrounding US-Iran peace talks and its potential impact on global risk appetite. Meanwhile, traders are focused on developments in Hong Kong's property sector, following reports that stricter restrictions on overseas capital transfers from mainland China could dampen demand from wealthy Chinese buyers, potentially slowing the recent surge in local property purchases.
Sector Performance:
Leading Gainers: Internet Technology (+3.8%): Heavyweight stocks led the gains, with Tencent Holdings **+7.75%, Meituan
+7.73%, Alibaba +5.29%**, driven by AI and earnings expectations.
Online Live Streaming/Short Drama Games (+5.1%): Weimob Group **+16.18%, Brilliant Tomorrow +14.29%**, driven by policy benefits and expectations of monetizing traffic.
New Energy Vehicles (+2.9%): BYD **+6.1%, NIO +5.3%**, driven by better-than-expected May delivery data.
Leading Losers: Building Energy Efficiency (-2.8%): Green Economy **-10.81%, China Resources Building Materials Technology -
3.15%**, driven by weak demand in the real estate supply chain.
Pharmaceuticals & Biotechnology (-1.9%): The Hang Seng Biotechnology Index fell over 3% intraday, with Zhipu AI** down 4.2% and MiniMax down 3.5%**, valuations under pressure.
Airlines (-1.5%): Air China** down 1.67% and China Southern Airlines down 2.1%**, rising oil prices suppressing profit expectations.
Technical Analysis:
The Hang Seng Index closed at 25990.01 points, a significant intraday gain of 2.33%, exhibiting a "rebound from oversold conditions + short-term bullish dominance" pattern, while remaining in a consolidation and recovery channel in the medium term. Tuesday's large-volume bullish candle broke through the previous high of 25486, demonstrating strong short-term momentum; the pullback from 25800 to around 25000 in late May represents a technical rebound after a rapid correction. The weekly chart shows an upward channel and consolidation pattern since the March low of 24700, with 24700 as the key bottom and 27000 as the upper resistance level. The 5/10-day moving averages are in a golden cross, indicating a short-term bullish trend. The 20-day moving average is at resistance at 25863, a key level for medium-term strength/weakness. Technical indicators: RSI (14) has rebounded from oversold territory (<30) to 55, indicating restored bullish momentum but not yet overbought; the MACD histogram is shortening, with a golden cross expected, suggesting a bullish medium-term bias.
Trading Strategy (Short-term focus):
1. Long: Enter on a pullback to 25400–25500 with a stop-loss at 25200, and a target of 26000→26300. 2. Short Selling: Consider a small short position if the price rallies to 26000-26300 and then falls back, with a stop-loss at 26500 and targets of 25500-25200.
3. Position Size: Use a small position (30-50%) in a volatile market, with strict stop-loss orders. Avoid chasing highs.
Risk Warning:
There is significant resistance at 26300-26500; a breakout requires significant volume, otherwise a pullback is likely.
24700 is the mid-term support level; a break below this level would indicate a deteriorating trend.
External market volatility and policy news may disrupt the technical rhythm; a flexible approach is necessary.
Disclaimer: The information contained herein (1) is proprietary to BCR and/or its content providers; (2) may not be copied or distributed; (3) is not warranted to be accurate, complete or timely; and, (4) does not constitute advice or a recommendation by BCR or its content providers in respect of the investment in financial instruments. Neither BCR or its content providers are responsible for any damages or losses arising from any use of this information. Past performance is no guarantee of future results.
Lebih Liputan


Pendedahan Risiko:Instrumen derivatif diniagakan di luar bursa dengan margin, yang bermakna ia membawa tahap risiko yang tinggi dan terdapat kemungkinan anda boleh kehilangan seluruh pelaburan anda. Produk-produk ini tidak sesuai untuk semua pelabur. Pastikan anda memahami sepenuhnya risiko dan pertimbangkan dengan teliti keadaan kewangan dan pengalaman dagangan anda sebelum berdagang. Cari nasihat kewangan bebas jika perlu sebelum membuka akaun dengan BCR.
Notis Bidang Kuasa:Perkhidmatan kami tidak bertujuan untuk penduduk Amerika Syarikat & Kanada, dan kami tidak berhasrat untuk mengedarkan atau menggunakan maklumat yang diberikan di mana-mana negara atau bidang kuasa yang berlawanan dengan undang-undang atau peraturan tempatan. Adalah penting untuk anda membaca dan mempertimbangkan dokumen undang-undang yang berkaitan dengan akaun anda, termasuk Terma dan Syarat yang dikeluarkan oleh BCR sebelum anda memulakan perdagangan. BCR Co Pty Ltd dikawal selia oleh Suruhanjaya Perkhidmatan Kewangan Kepulauan Virgin British, Sijil No. SIBA/L/19/1122. Nombor Pendaftaran di BVI ialah 1975046. Alamat Berdaftar Syarikat ialah Trident Chambers, Wickham’s Cay 1, Road Town, Tortola, Kepulauan Virgin British.
BCR Co Pty Ltd (No. Syarikat 1975046) ialah syarikat yang diperbadankan di bawah undang-undang British Virgin Islands, dengan pejabat berdaftar di Trident Chambers, Wickham’s Cay 1, Road Town, Tortola, British Virgin Islands, dan dilesenkan serta dikawal selia oleh Suruhanjaya Perkhidmatan Kewangan British Virgin Islands di bawah Lesen No. SIBA/L/19/1122.
Open Bridge Limited (No. Syarikat 16701394) ialah syarikat yang diperbadankan di bawah Akta Syarikat 2006 dan berdaftar di England dan Wales, dengan alamat berdaftar di Kemp House, 160 City Road, London, England, EC1V 2NX. Open Bridge Limited bertindak semata-mata sebagai pemproses pembayaran untuk BCR Co Pty Ltd dan tidak menyediakan sebarang perkhidmatan kewangan, perdagangan atau pelaburan bagi pihaknya. Peranan Open Bridge Limited adalah terhad kepada pemprosesan pembayaran.

 English
 简体中文
简体中文
 繁體中文
繁體中文
 Bahasa
Melayu
Bahasa
Melayu
 Tiếng
Việt
Tiếng
Việt
 ไทย
ไทย
 日本語
日本語
 한국어
한국어
 ភាសាខ្មែរ
 español