


0
US Dollar Index
The US dollar index rose to a high of 99.95 on Wednesday, extending the previous session's gain of nearly 0.4%, as traders digested the latest FOMC minutes and waited for new catalysts amid ongoing trade tensions and fiscal policy developments under the Trump administration. The minutes of the last FOMC meeting showed that policymakers took a wait-and-see approach aimed at assessing the impact of recent government actions and tariff measures on the economy. Officials acknowledged that both unemployment and inflation risks have increased. On Sunday, President Trump postponed the implementation date of 50% tariffs on EU imports to July 9, a decision made a few days after the announcement of the sweeping measure. The dollar strengthened generally, especially against the yen, following reports that Japanese authorities may intervene to stabilize its bond market. Despite the recent rebound, the dollar remains close to its low in April 2023 and is still down more than 7% this year.
The US dollar index is set to see some rebound this week after two weeks of depreciation, a trend that strengthened on Wednesday after early signs on Monday. The US Dollar Index is expected to recover and find solid resistance. In addition, the 14-day relative strength index (RSI), a technical indicator on the daily chart, remains below 50 {around 48.00}, but the short-term trend continues to rise. On the upside, the 20-day simple moving average at 100.17 is the first resistance level for the US Dollar Index, followed by the 100.58 {May 20 high}. If the US dollar bulls push the US Dollar Index higher further, the key round number level of 101.00 will come into play. If the US Dollar Index faces some new selling pressure, a decline towards the 99.46 {5-day simple moving average}, and 99.44 {Wednesday low} area may occur. Further below, technical support is relatively weak at the 99.00 round number level, followed by the 98.69 low at the beginning of this week.
Consider shorting the dollar index near 100.00 today, stop loss: 100.10, target: 99.50, 99.40

WTI spot crude oil
WTI crude oil prices rose to around $62.00 per barrel on Wednesday, reversing a sharp drop in the previous trading day on concerns that the United States may impose new sanctions on Russia, which may tighten global supply. On Tuesday, President Trump expressed disappointment with Russian President Vladimir Putin when Ukraine peace talks reached an impasse, suggesting that new sanctions against Moscow may be announced this week. In addition, the United States banned Chevron from exporting Venezuelan crude oil under a new authorization, allowing the company to retain assets but not export oil, increasing demand for Middle Eastern crude oil. On the trade front, EU officials are gathering information on investments by major U.S. companies after Trump slowed plans to impose heavy tariffs on European goods. The market is now awaiting the upcoming OPEC+ meeting, which is expected to discuss a possible increase in production of about 411,000 barrels per day.
The eight member countries of the Organization of Petroleum Exporting Countries and its allies (OPEC+) will hold a meeting on Saturday and may make a decision on the production plan for July. If OPEC+ maintains the pace of production increase and the US-Iran relationship breaks the ice, the upside of oil prices may be limited. From a technical perspective, the daily chart of US crude oil (WTI) shows that the current price is supported above $60 {market psychological barrier}, the short-term moving average shows signs of stabilization, and the MACD indicator of the technical indicator has initially formed a golden cross at a low level, indicating that the short-term rebound momentum has increased. If it breaks through the $62.32 {45-day simple moving average} line in the future, it will be expected to test the resistance near the previous high of $63.48 {May 13 high}. On the contrary, if it falls below the $60 support level, it may fall back to the $58.50 mark and the low of $58.37 on April 10.
Consider going long on crude oil near 61.40 today, stop loss: 61.20; target: 62.80; 63.00

Spot gold
Gold traded around $3,300 an ounce on Wednesday, with little price movement as investors weighed minutes from the Federal Reserve's May meeting, which revealed growing concerns about inflation and a weak labor market, partly due to trade tensions and proposed tariffs. The Fed maintained a cautious stance, opting to keep interest rates unchanged for a third consecutive meeting while acknowledging increased economic uncertainty and warning about inflation and employment risks. Although the economy remains solid, officials warned of downgrades to growth forecasts and rising recession risks. Gold has risen 26% this year, hitting a record high in April, and continues to attract safe-haven demand amid uncertainty and expectations of a pause in interest rates. Goldman Sachs recommends increasing gold allocations, citing pressure on U.S. institutions and strong central bank gold buying. Meanwhile, U.S. gold exports to Switzerland surged in April as tariffs on precious metals were lifted.
From a bigger picture perspective, gold prices are in a large consolidation range as the market awaits the next key catalyst to trigger a breakout and a more sustained trend. Gold prices remain stable, hovering at the bottom of $3,300, and the 14-day relative strength index (RSI) on the daily chart technical indicator analysis also remains comfortably above 50, indicating continued upward momentum. Expected to consolidate in the range of $3,245 (April 11 high)-$3,365 {last week high}. However, the uptrend remains intact and buyers are eyeing a breakout above $3,340 as the first level of interest, followed by resistance at last week's high of $3,365. Higher resistance opens the door at the round number mark of $3,400. On the bearish side, if gold falls below $3,258.00 {40-day simple moving average}, a move towards $3,245 (April 11 high} is expected.
Consider going long on gold today before 3,283, stop loss: 3,280; target: 3,310; 3,315

AUD/USD
The Australian dollar fell to a low of around $0.6410 on Wednesday, extending its recent decline despite stronger-than-expected inflation data. The monthly CPI measure for April was 2.4%, unchanged from the previous two months but slightly above market expectations of 2.3%. The data provided limited support to the currency as markets remained focused on the dovish outlook of the Reserve Bank of Australia. The central bank cut interest rates by 25 basis points last week and expects further easing in the coming months. Policymakers have pointed to downside risks to growth due to escalating U.S.-China trade tensions and slowing inflation. The market currently sees a 65% chance of another rate cut in July, with the central bank expected to cut interest rates by 1.3% by 2025. The cumulative rate cut will be 75 basis points in the first quarter of 2026. The US dollar continues to strengthen, which exacerbates the weakness of the Australian dollar, due to the improvement in US economic sentiment.
AUD/USD traded around 0.6430 on Wednesday, maintaining a bullish bias. Technical analysis on the daily chart shows that the pair is still within the ascending channel pattern. However, short-term price momentum weakened as the pair fell below the {9-day simple moving average} of 0.6442. The 14-day relative strength index (RSI) of the technical indicator is slightly above 50, indicating that the upward momentum is still in play. On the upside, AUD/USD may test 0.6442 {9-day simple moving average} immediate resistance, followed by 0.6495, Tuesday's high, and the 0.6500 {round mark} area, further to the 0.6537 six-month high, which was recorded on May 26. AUD/USD may test the 0.6400 round mark amid weakening short-term price momentum. A decisive break below these levels will weaken short-term and medium-term price momentum and open the door for the pair to hover around 0.6366 {40-day simple moving average}.
Today, it is recommended to go long on the Australian dollar before 0.6415, stop loss: 0.6400, target: 0.6460, 0.6470

GBP/USD
GBP/USD slipped below $1.3470 as the dollar regained strength, although it remained close to a three-year high of more than $1.3560 reached on May 26. The pound was pressured by a rebound in the dollar, which was driven by strong U.S. consumer confidence and trade deal optimism. Despite the decline, sentiment toward the U.K. economy improved. The International Monetary Fund raised its 2025 growth forecast for the U.K. to 1.2% from 1.1%, but also warned Chancellor Rachel Reeves to stick to her fiscal rules as a spending review looms on June 11. Meanwhile, inflation remains persistent. Grocery prices rose in May, according to Kantar. Prices rose 4.1% year-on-year, the highest since February 2024, prompting consumers to seek discounts and cheaper brands. As a result, traders expect the Bank of England to cut interest rates by only about 40 basis points by the end of the year.
Technically, the constructive outlook for GBP/USD remains as the major currency pair is firmly above the key 20-day simple moving average of 1.3351 on the daily chart. The 14-day relative strength index (RSI) of the technical indicator is above 55.00, showing bullish momentum in the short term, further strengthening the upward momentum. The immediate resistance level for the major currency pair is at 1.3500 {round mark}. If the rally continues, we may see prices rise to 1.3560 {upper Bollinger Band line on the daily chart}, Then 1.3620 {February 22, 2023 high}. On the other hand, initial support for GBP/USD is at 1.3400 {round mark}, and 1.3391, the low of May 22. If trading below this level continues, it may fall to the 20-day simple moving average of 1.3351.
Today, it is recommended to go long GBP before 1.3454, stop loss: 1.3440, target: 1.3510, 1.3520

USD/JPY
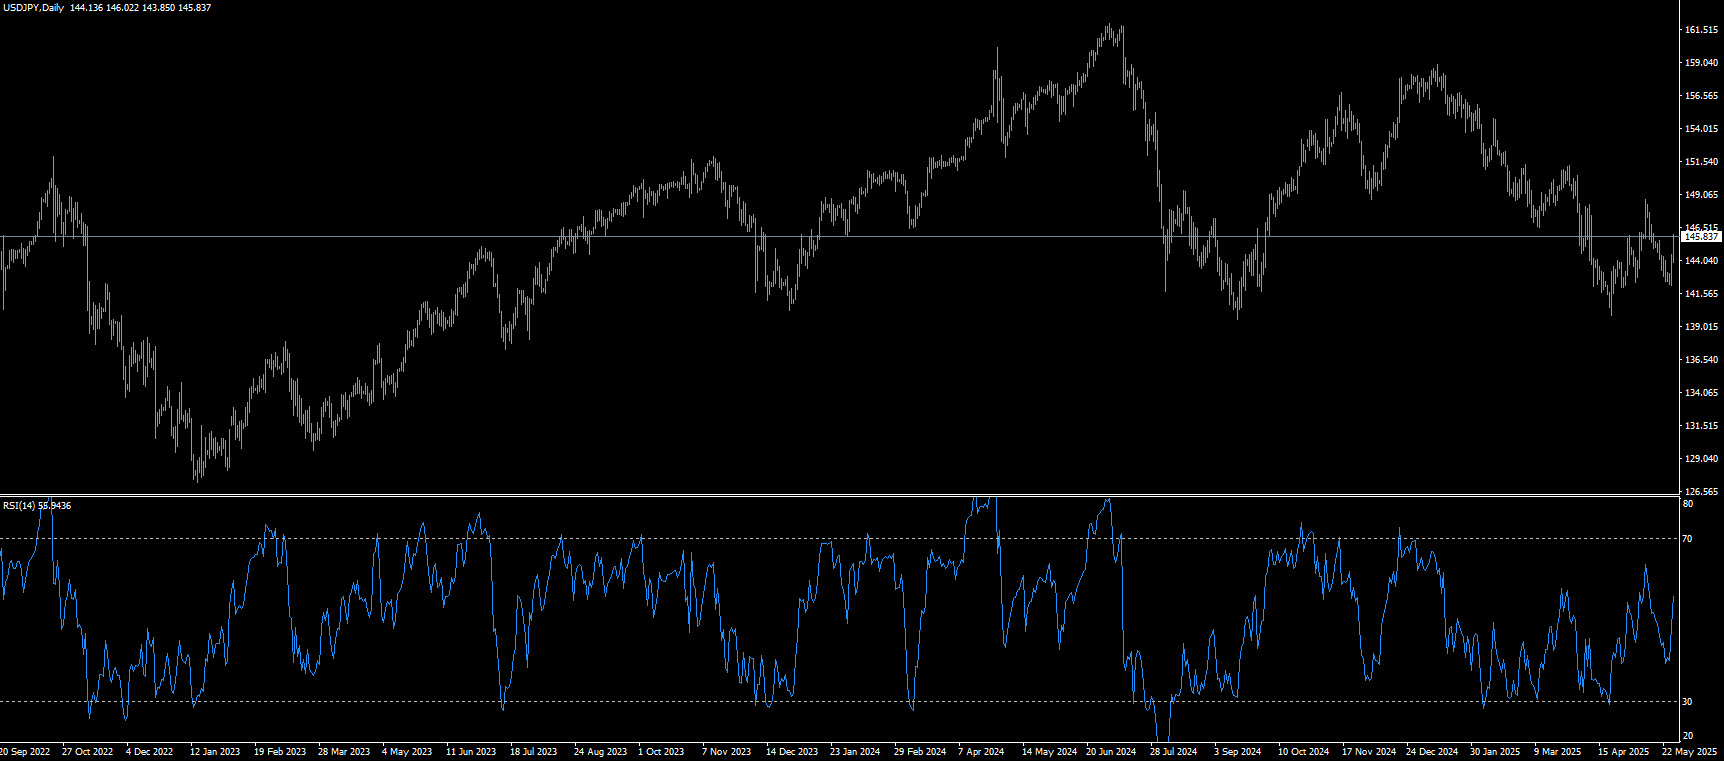
The yen rebounded after hitting a one-week low against the dollar early Wednesday, although the gains lacked sustainability. Investors now seem to believe that the Bank of Japan will continue to raise interest rates amid rising inflation in Japan. In addition, uncertainty about U.S. President Trump's tariff policy and geopolitical risks also helped limit the yen's losses. However, the overall positive risk sentiment made traders reluctant to make aggressive bullish bets on the yen. On the other hand, the dollar was supported by mostly upbeat U.S. macro data on Tuesday and provided a tailwind for the USD/JPY pair. At the same time, the market is betting that the Federal Reserve will cut interest rates further in 2025, which is a significant difference from the hawkish expectations of the Bank of Japan, limiting the dollar's gains and favoring yen bulls.
From the technical indicators on the daily chart, the 14-day relative strength index (RSI) is still slightly below 50, indicating a moderate weakening trend. The constructive outlook has not yet been confirmed, which deserves caution. Therefore, any subsequent gains may face strong resistance and be limited around the psychological level of 145.00. Next is 145.40 {50.0% Fibonacci retracement of 139.89 to 148.65}, and 145.42{50-day simple moving average} area, which, if broken, should pave the way for additional gains to 146{round mark}. On the other hand, the 144.00 mark, followed by 143.24{61.8% Fibonacci retracement of 139.89 to 148.65}, may provide some support for the USD/JPY pair. A successful break of the latter will indicate that the corrective rebound has lost momentum and drag the spot price back to the 143.00 round mark. Some follow-up selling may expose the weekly low, around the 142.10 area, or the monthly low.
Today, it is recommended to short the US dollar before 144.95, stop loss: 145.15; target: 144.00, 143.80
EUR/USD
EUR/USD fell for the second day in a row, trading slightly below 1.1300 during the session. The pair depreciated as the dollar found support while US yields depreciated as Japan indicated that it may cut government debt issuance, which boosted global bond markets. In addition, the dollar found support as the Conference Board's consumer confidence index rose to 98.0 in May, compared with 86.0 in the previous period. Meanwhile, US durable goods orders fell 6.3% in April, compared with a 7.6% increase previously. However, the risk-sensitive euro found support as trade tensions between the United States and the European Union eased. On Sunday, US President Trump extended the deadline for tariffs on EU imports from June 1 to July 9. On the other hand, European Central Bank President Christine Lagarde said that the euro could become a viable alternative to the US dollar as a global reserve currency. However, she pointed out that this could happen if governments strengthen the financial and security architecture of the euro zone.
From the daily chart, Despite facing strong resistance at 1.1400, EUR/USD is biased to the upside. The pair’s price action at the beginning of the week formed an “inverted hammer” pattern, a candlestick pattern that suggests sellers may be in control. However, further confirmation was needed at the time. Currently, the pair has broken below Monday’s low of 1.1358, opening the door to lower prices. A daily close below 1.1300 could lead EUR/USD to fall towards 1.1275. Further downside support is at the 40-day simple moving average of 1.1254, followed by the 1.1200 round number level. On the upside, if EUR/USD stays above 1.1350 {Wednesday’s high}, the next resistance will be 1.1400 {round number}, and the May 26 high of 1.1418.
Today, it is recommended to go long on EUR before 1.1280, stop loss: 1.1265 target: 1.1340, 1.1350

Disclaimer: The information contained herein (1) is proprietary to BCR and/or its content providers; (2) may not be copied or distributed; (3) is not warranted to be accurate, complete or timely; and, (4) does not constitute advice or a recommendation by BCR or its content providers in respect of the investment in financial instruments. Neither BCR or its content providers are responsible for any damages or losses arising from any use of this information. Past performance is no guarantee of future results.
More Coverage


Risk Disclosure:Derivatives are traded over-the-counter on margin, which means they carry a high level of risk and there is a possibility you could lose all of your investment. These products are not suitable for all investors. Please ensure you fully understand the risks and carefully consider your financial situation and trading experience before trading. Seek independent financial advice if necessary before opening an account with BCR.
Jurisdiction Notice:Our services are not intended for residents of the United States & Canada, and we do not intend to distribute or use the provided information in any country or jurisdiction where it would be contrary to local law or regulation. It is important that you read and consider the relevant legal documents associated with your account, including the Terms and Conditions issued by BCR before you start trading. BCR Co Pty Ltd is regulated by the British Virgin Islands Financial Services Commission, Certificate No. SIBA/L/19/1122. The Registration Number in the BVI is 1975046. The Registered Address of the Company is Trident Chambers, Wickham’s Cay 1, Road Town, Tortola, British Virgin Islands.

 English
 简体中文
简体中文
 繁體中文
繁體中文
 Bahasa
Melayu
Bahasa
Melayu
 Tiếng
Việt
Tiếng
Việt
 ไทย
ไทย
 日本語
日本語
 한국어
한국어
 ភាសាខ្មែរ
 español