


0
Currency & Commodity Analysis:
US Dollar Index
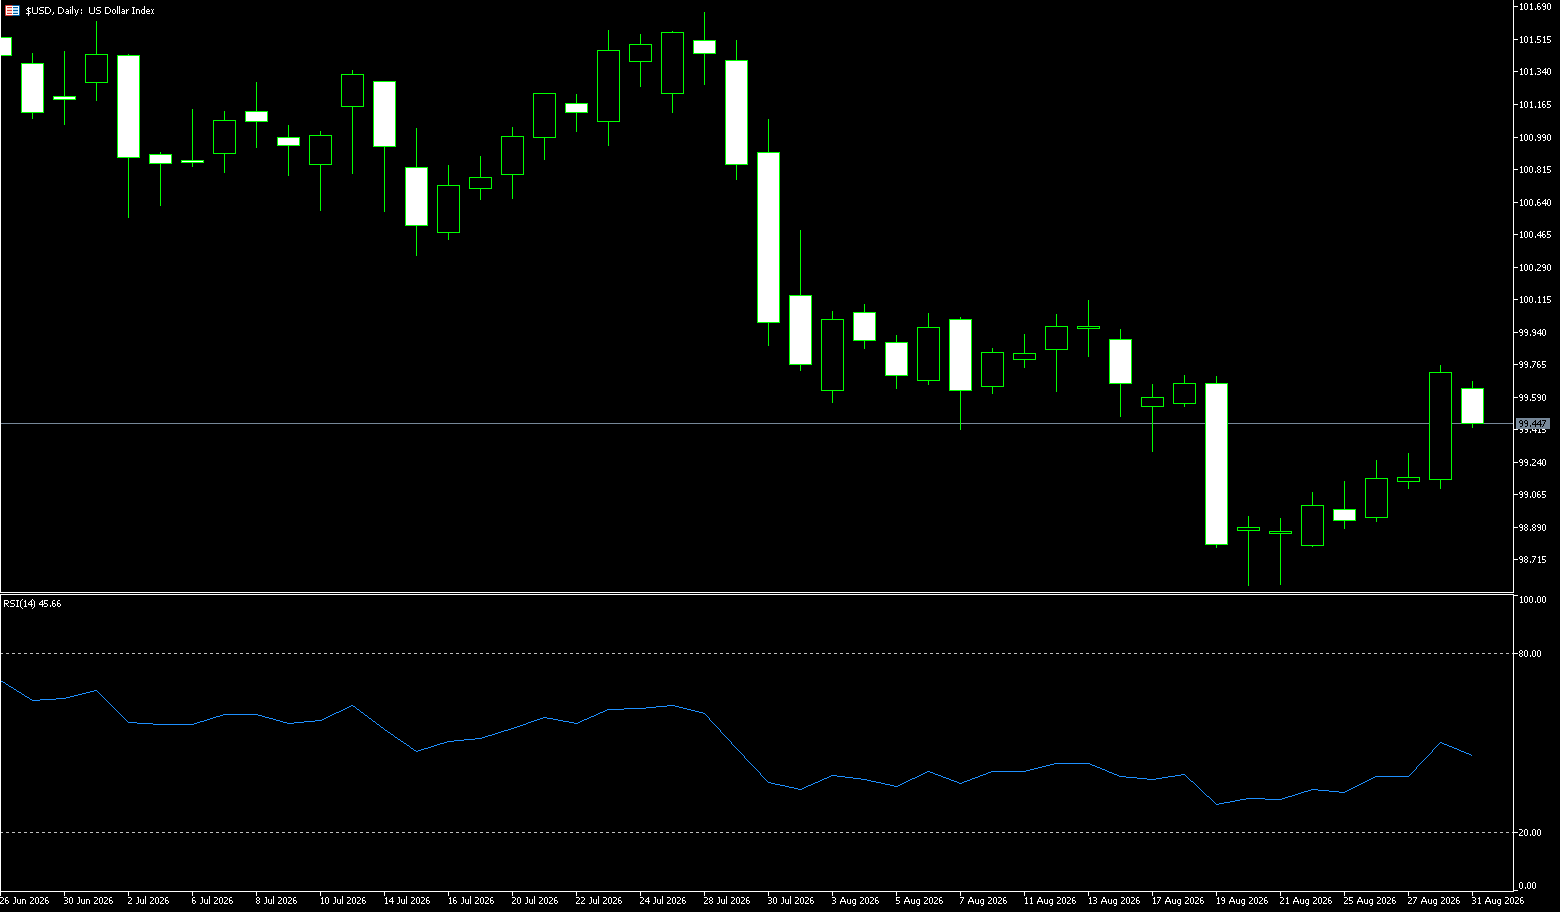
The US dollar index dipped slightly to 99.40 on Monday, pausing after a three-day rally that pushed the dollar to a two-week high as traders increased their bets on a Federal Reserve rate hike in September. These expectations were further reinforced by comments made by Fed Chairman Walsh at Friday's Jackson Hole symposium, where he stated that the Fed would have "work to do" if policymakers failed to be confident that inflation was moving toward its 2% target. Walsh has consistently emphasized the need to reduce inflation, although the Fed kept rates unchanged at its June and July meetings, leaving some uncertainty about the timing of potential action. The market estimates a roughly 64% probability of a 25 basis point rate hike in September. Traders are now awaiting a series of key economic data that could help determine the Fed's next move, including Friday's jobs report. The dollar index is expected to fall by about 0.2% in August, marking its second consecutive monthly loss.
From a technical perspective, the US dollar index quickly recovered lost ground and refreshed its intraday high after Fed Chairman Warsh's speech, indicating an immediate reassessment of the policy statement by the market; on the daily chart, the US dollar index is currently trading at 99.65. The index maintains a bullish pattern, standing above the 9-day (99.11) and 20-day (99.48) simple moving averages, both of which are trending upwards and provide support for a broader uptrend. The latest rally has also held above the uptrend line support, keeping the short-term tone positive; meanwhile, the Relative Strength Index (RSI) is around 49, which may slow the rally rather than directly reverse the trend. On the upside, initial resistance is at the horizontal level near 99.71 (the 100-day simple moving average), followed by the psychological level of 100. Given the already stretched intraday momentum, a pause or pullback would not be unexpected. On the downside, support lies near 99.11 (the 9-day simple moving average), followed by stronger support at the psychological level of 99.
Today, consider shorting the US Dollar Index at 99.52, with a stop-loss at 99.63 and targets at 99.10 and 99.05.
WTI Crude Oil
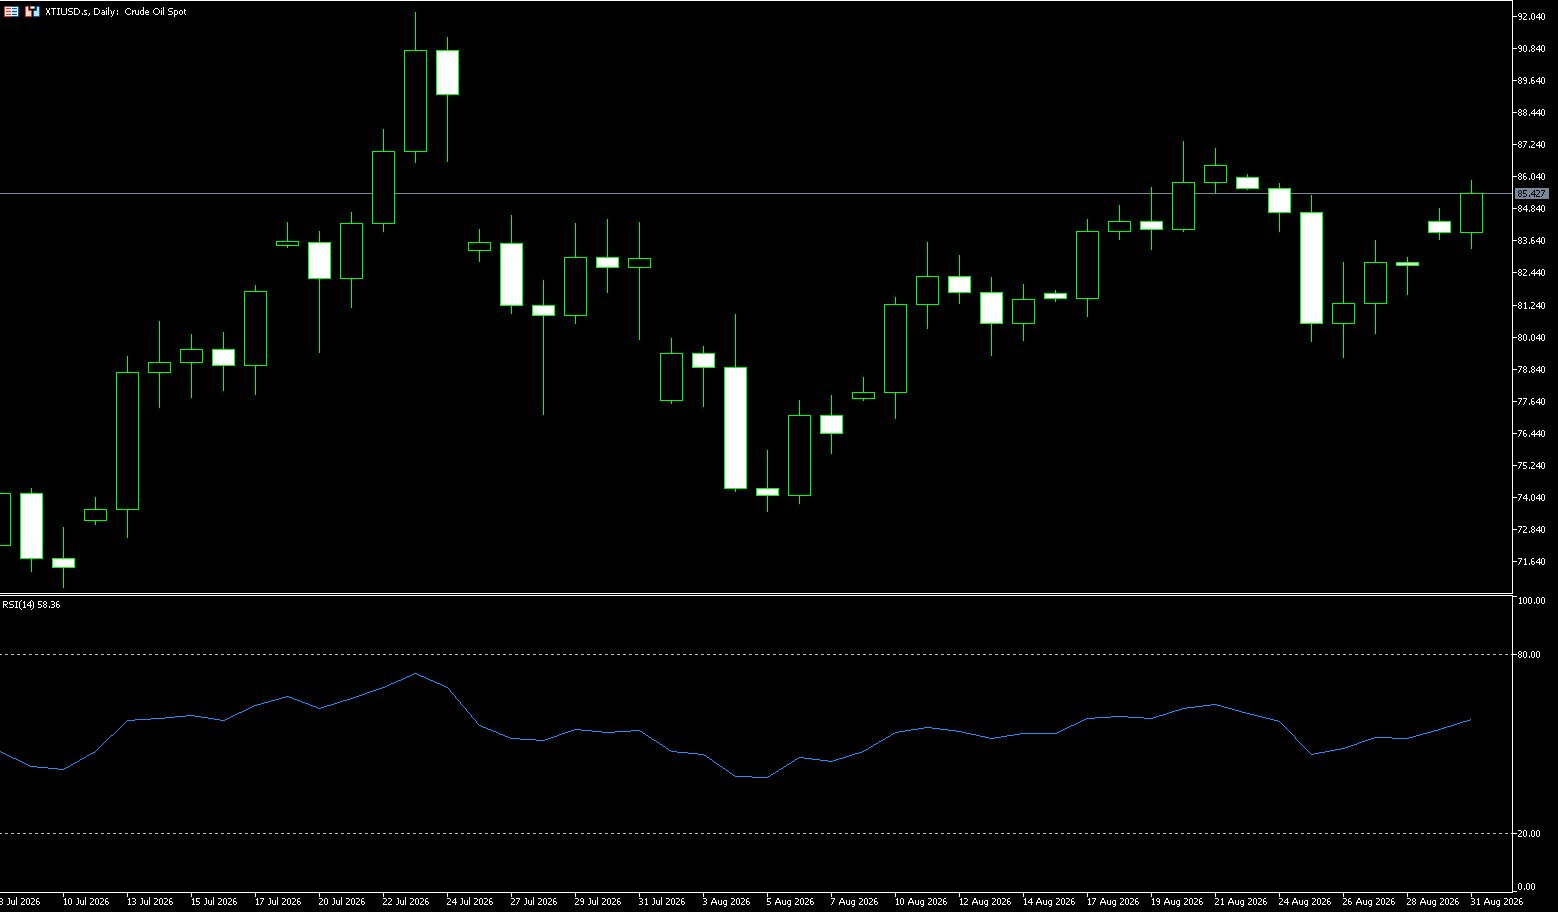
On Monday, crude oil prices broke through $85 a barrel as tensions escalated in the Middle East, with the US and Iran exchanging attacks for the first time in about a month, raising growing concerns about security in the Strait of Hormuz. The US military struck Iranian military assets after discovering Iran was preparing to lay mines in waterways, and Iran responded with missile and drone strikes against US facilities in Jordan. Iranian media also reported that an oil tanker struck two mines, and authorities seized a bulk carrier near Hormuz, although US Central Command stated that no ships encountered mines in Hormuz. These developments have heightened concerns that further military escalation could disrupt shipping and tighten global energy supplies. Oil prices rose about 1% in August, following a 21.8% increase in July. Despite the risks, an estimated 6 to 8 million barrels of crude oil per day still pass through Hormuz, mainly from other Gulf oil-producing countries.
Considering these multiple variables, the current oil market is under pressure from both diminishing geopolitical premiums on the supply side and strengthening macroeconomic headwinds on the demand side. If the Strait of Hormuz can be reopened to navigation in stages, WTI oil prices may fall to the $70-$75 range; if negotiations break down, they could rebound quickly to above $90-$95. While the US-Venezuela agreement is a long-term negative, its short-term psychological impact outweighs actual supply and demand changes. Looking at the daily chart for WTI crude oil, the latest price is near the 9-day moving average of $83.75. After falling from around $87.38, the price briefly touched a low of $79.28, and has now returned to the vicinity of the middle band. In terms of MACD, the DIFF is approximately 0.89, the DEA is approximately 1.22, and the histogram value is approximately -0.65. The DIFF is still above the zero line but below the DEA, reflecting a weakening of short-term momentum compared to the previous period. On the upside, watch the $86.14 area (last week's high); then $87.38 (August 20th high). On the downside, watch the 9-day moving average at $83.75; a break below this level would target the 20-day moving average at $81.59.
Consider going long on crude oil today at $85.28, with a stop-loss at $85.10 and targets at $87.00 and $88.00.
Spot Gold
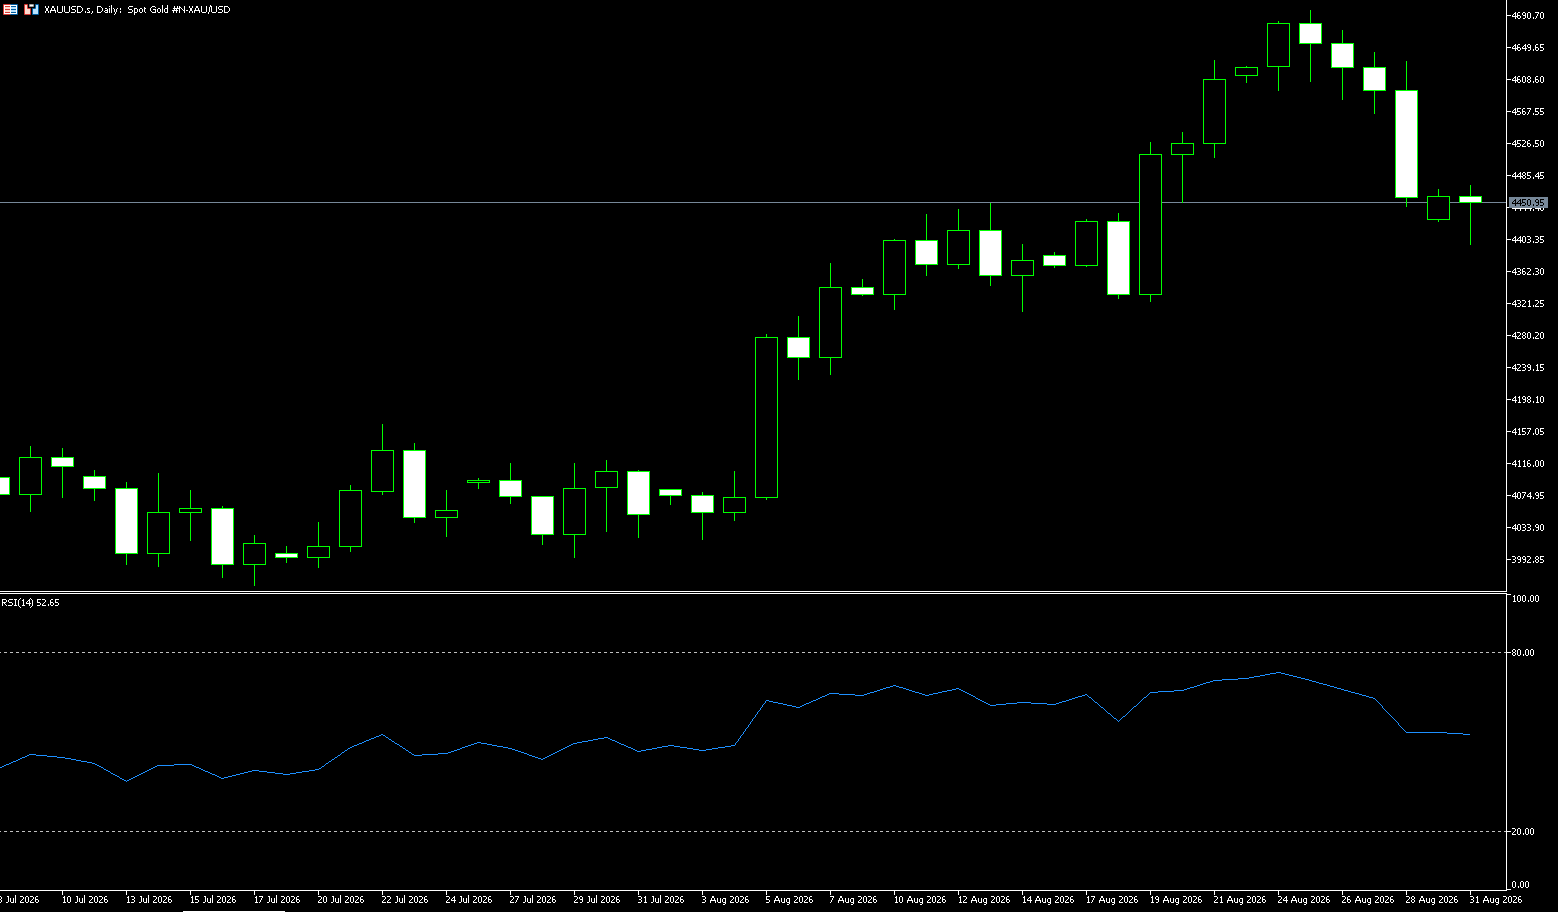
On Monday (August 31, Beijing time) in early Asian trading, spot gold was trading around $4,460 per ounce. Although gold prices initially touched a near two-week low due to hawkish comments from Fed Chairman Warsh on Friday, renewed geopolitical tensions following the US attack on a southern Iranian island pushed prices back up. This was influenced by Fed Chairman Warsh's hawkish remarks at the Jackson Hole symposium, which hinted at possible further interest rate hikes. Warsh stated that "there's still work to be done" if there's no certainty that inflation will return to the 2% target. This caused traders' bets on a September rate hike to rise from 36% pre-meeting to 58%, and the probability of a December rate hike to 89%. Simultaneously, the dollar index strengthened to a more than one-week high, further pressuring gold, a non-interest-bearing asset. It's worth noting that the decline in gold prices was accompanied by a sharp rise in the dollar index and rising real interest rates, forming a typical negative feedback loop, reflecting that the market is rapidly pricing in a "higher and longer" interest rate scenario. However, from a longer-term perspective, current gold prices are still far above the levels at the beginning of the year, and structural supporting factors such as global debt expansion and geopolitical fragmentation have not disappeared. Friday's decline was more of an emotional release triggered by expectation gaps than the beginning of a trend reversal.
In the short term, gold still faces the risk of further correction, but as long as key trend support levels are not effectively broken, the market cannot yet define this pullback as a trend reversal. From a daily chart perspective, gold is currently still in a medium-term bullish trend, with prices previously consistently trading above important trend moving averages. This week's surge to $4,697 followed by a rapid pullback indicates significant profit-taking around $4,700. The RSI, previously in bullish territory, has cooled somewhat with the price correction, suggesting weakening upward momentum. If the $4,500 (psychological level) and $4,529 (200-day simple moving average) levels are re-established, further attention should be paid to the $4,600 psychological level. On the downside, the $4,413 (21-day simple moving average) level and the $4,400 (psychological level) area present significant resistance. The next key area to watch is the $4,370 (100-day simple moving average) level.
Today, consider going long on gold at $4,442, with a stop-loss at $4,438 and targets at $4,490 and $4,500.
AUD/USD
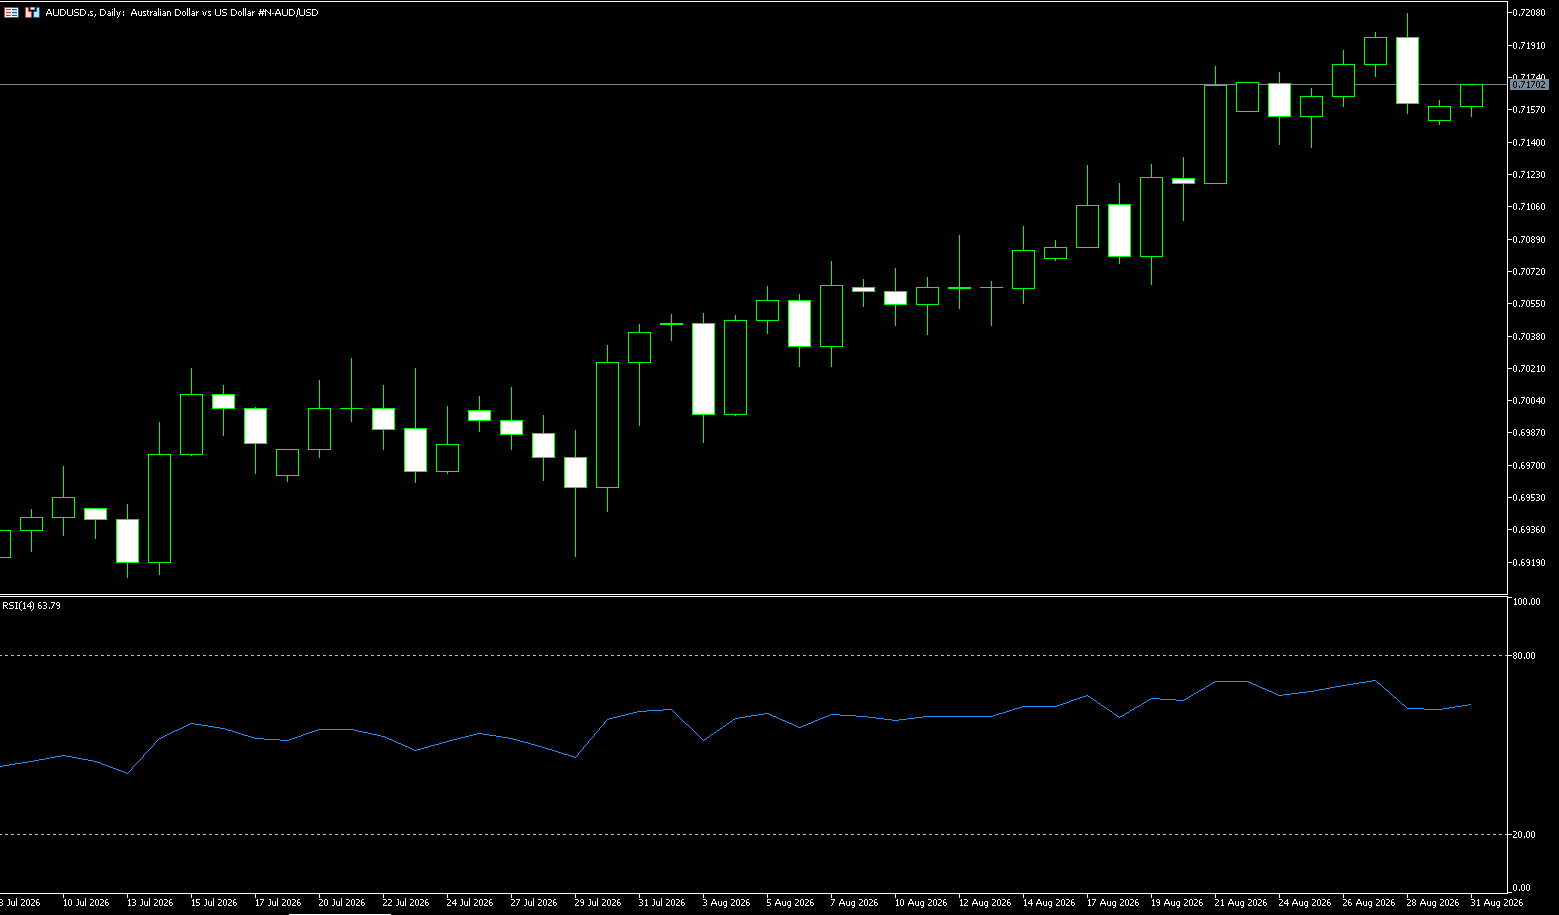
The Australian dollar remains below US$0.72 but is still near its highest level since early June and is on track for its second consecutive monthly gain, driven by increasing likelihood of an interest rate hike. The market now prices a 52% probability of a fourth rate hike, a significant increase from 17% previously, and a November hike is already fully priced in. Stronger-than-expected July inflation reports and robust household consumption data have fueled greater optimism about tightening, prompting several major banks to revise their forecasts. National Australia Bank expects action as early as its September 29-30 meeting, while Commonwealth Bank and ANZ expect a November hike but acknowledge the possibility of earlier tightening. Meanwhile, the US dollar generally rose after Federal Reserve Chairman Kevin Warsh took a hawkish stance in his first speech at last week's Jackson Hole symposium, suggesting policymakers may need to take further action if inflation remains high.
From a technical perspective, the AUD/USD pair is holding above the 20-day simple moving average at 0.7106, showing a slightly bullish short-term bias. However, momentum is not strong, with the 14-day Relative Strength Index (RSI) hovering around 62 and the Moving Average Convergence Divergence (MACD) indicator slipping slightly into negative territory. This, in turn, suggests that upward pressure is slowing rather than accelerating. On the downside, initial support lies at the current 20-day simple moving average at 0.7106 and the 0.7100 (psychological level) area, which should act as an immediate pivot point. Following this is stronger structural support near 0.7077, at the 100-day simple moving average. As long as the AUD/USD remains above this moving average, pullbacks could attract buyers. On the other hand, bulls need to wait for sustained strength and a break above 0.7200 before considering further gains towards 0.7264 (the May 14 high), followed by the nearby upper limit of 0.7300 (a psychological resistance level).
Consider going long on the Australian dollar at 0.7155 today, with a stop loss at 0.7145 and targets of 0.7190 and 0.7200.
GBP/USD
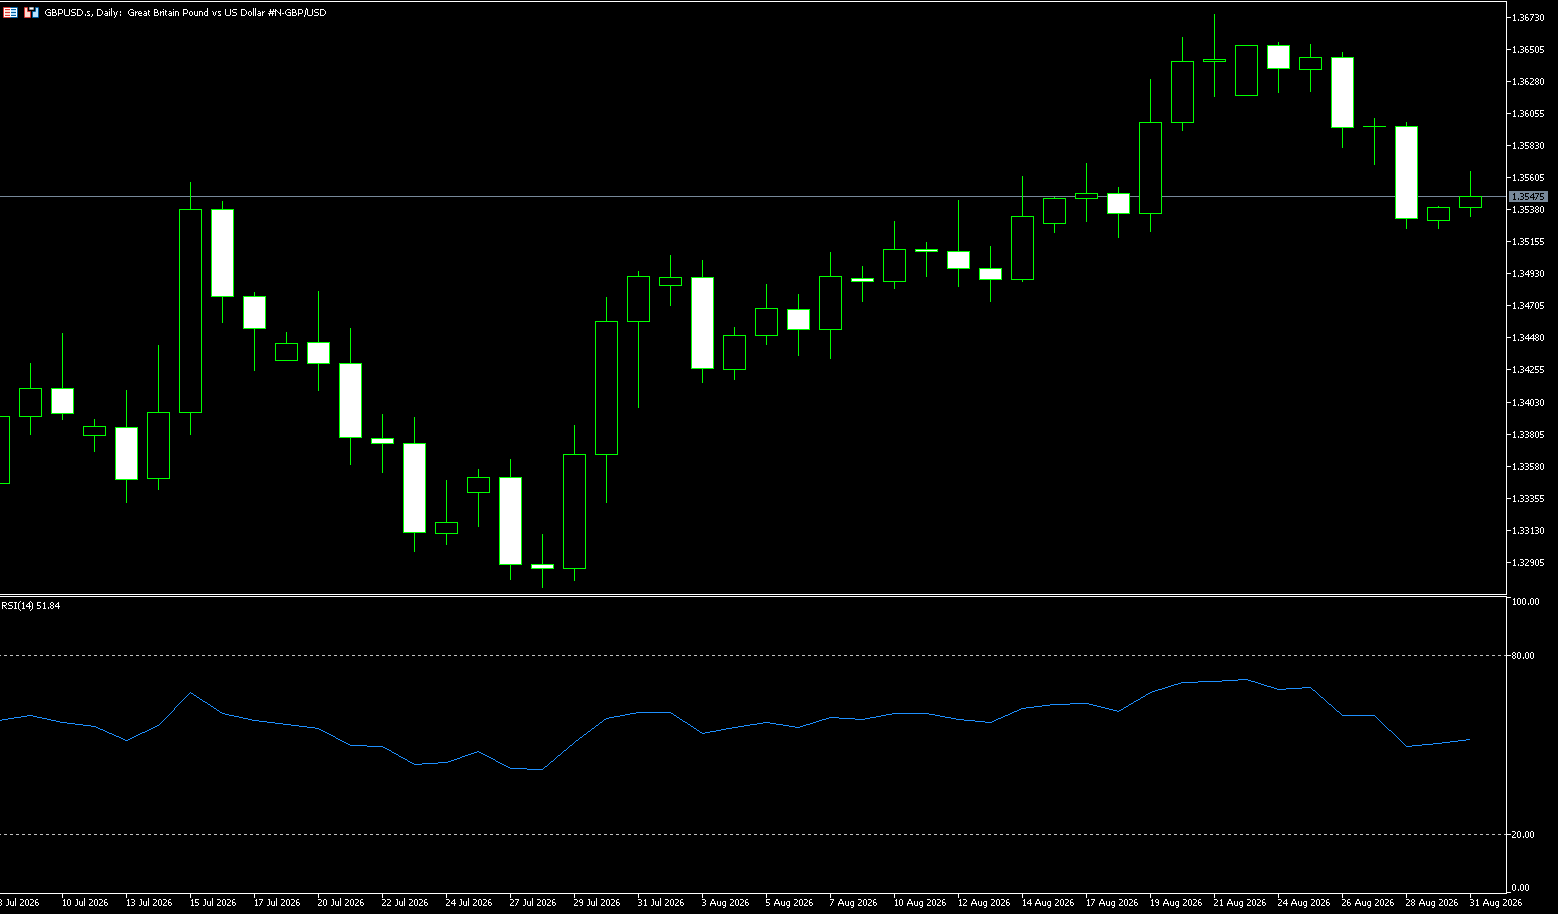
The pound rose slightly on Monday, but remained near a two-week low against the dollar. Risk aversion triggered by renewed hostilities between the US and Iran, along with rising market bets that the Federal Reserve might finally raise interest rates in September, limited the dollar's pullback at the start of the week. Investor risk appetite remained fragile on Monday after reports that the US had launched its first attack on Iran in about a month, targeting missile launchers on Larak Island. The Islamic Revolutionary Guard Corps (IRGC) was reportedly preparing to launch rockets to lay mines in the Strait of Hormuz. According to Fox News, citing US sources, Tehran subsequently attacked US military facilities in Jordan, and the IRGC vowed to retaliate against the US with "response and punishment."
The GBP/USD pair traded between dense Fibonacci support and nearby moving average resistance at the start of the week, indicating a neutral short-term bias. The 100-period simple moving average on the 4-hour chart is currently at 1.3560, limiting upside, while the 23.6% Fibonacci retracement at 1.3579 further strengthens resistance above the current consolidation range. A break below this level would retest the psychological level of 1.3600. On the downside, initial support lies at the 38.2% Fibonacci retracement at 1.3521, followed by deeper structural support at the 50.0% retracement at 1.3474 and the 61.8% level at 1.3427, while the psychological level of 1.3400 marks a further bottom.
Today, consider going long on GBP at 1.3540, with a stop loss at 1.3530 and targets at 1.3590 and 1.3600.
USD/JPY
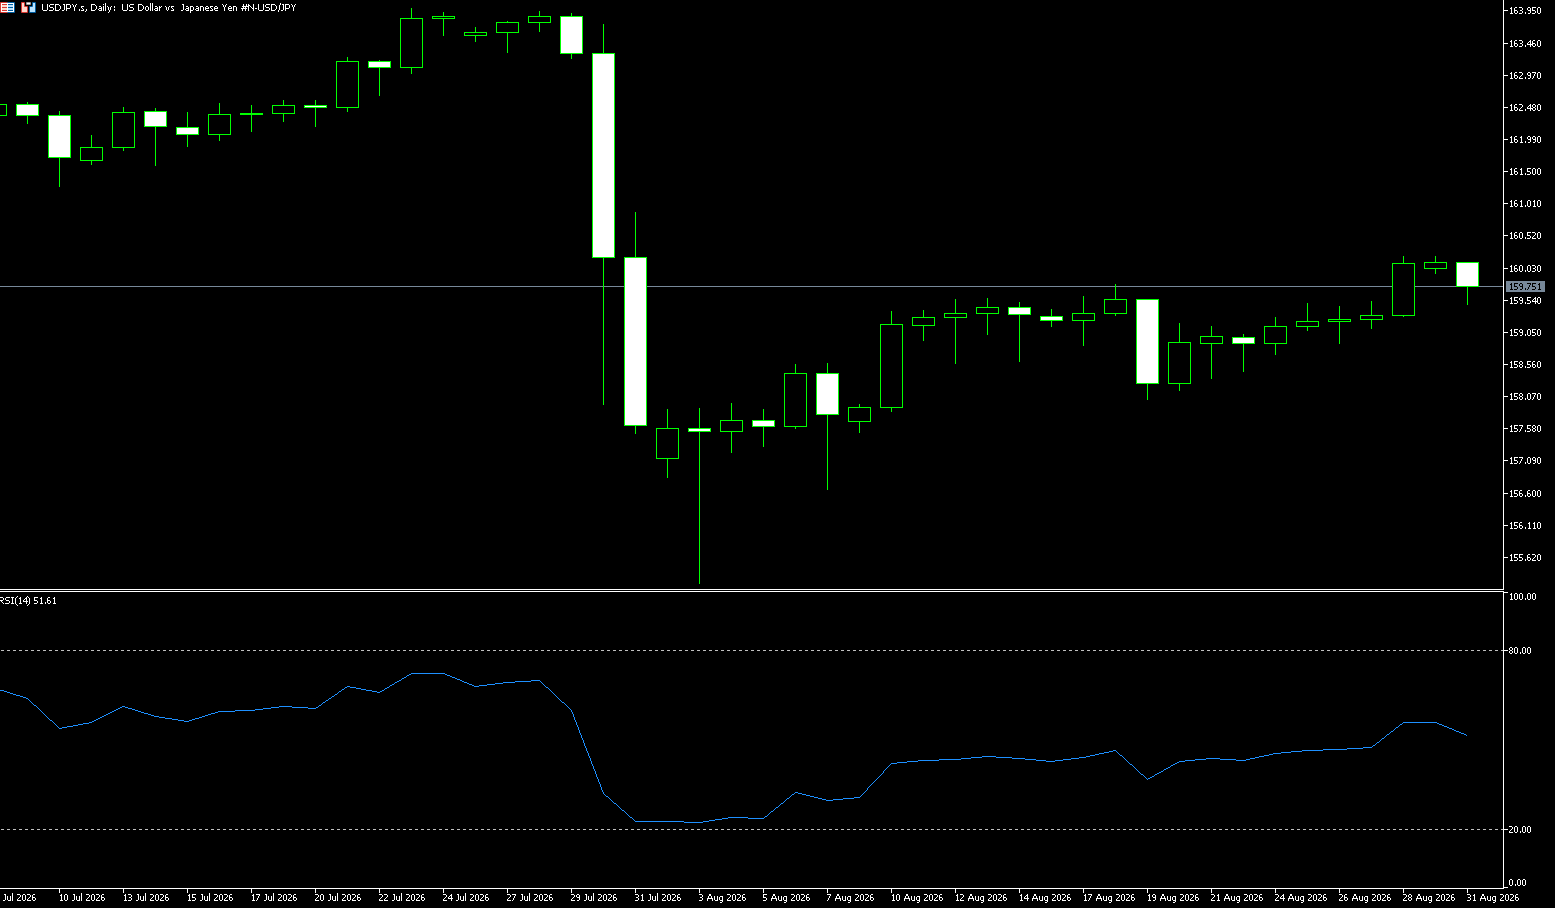
USD/JPY has retreated from the 160.20 area, a one-month high retested earlier this week, and now appears to have ended its five-day winning streak. The spot price has fallen to the 159.55-159.60 area, but downside appears limited. A slight pullback in the dollar is seen as a key factor putting downward pressure on USD/JPY amid rising bets on a faster rate hike by the Bank of Japan. However, market expectations of a Federal Reserve increase in borrowing costs next month, coupled with escalating US-Iran tensions, may prevent dollar shorts from taking aggressive bets. Furthermore, the large interest rate differential between the US and Japan, and concerns about Japan's deteriorating fiscal situation, should limit any substantial appreciation of the yen and help limit the decline in USD/JPY. Therefore, strong follow-through selling is needed to confirm that the recent rally from the 155.25-155.20 area, the monthly low, has lost momentum.
USD/JPY maintains a mildly bullish bias on the 4-hour chart, above the 100-period simple moving average at 159.13 and the 50.0% Fibonacci retracement level of the recent pullback from the 40-year high. Furthermore, the MACD indicator is slightly positive, while the Relative Strength Index (RSI) is around 55. Conversely, the momentum oscillator suggests constructive upward momentum, but not yet overextended. However, USD/JPY may still be capped by the 200-period simple moving average at 160.33. Following that is the higher-level consolidation at 160.88 (the July 31 high), which together outline the next bullish target if buying continues. On the downside, initial support lies at 159.55 (Monday's low) and the 50.0% Fibonacci retracement level at 159.58, with the 100-period simple moving average at 159.13 forming a further bottom before deeper Fibonacci support at 158.55 and 157.27.
Consider shorting the US dollar at 159.93 today, with a stop loss at 160.10 and targets at 159.20 and 159.10.
EUR/USD
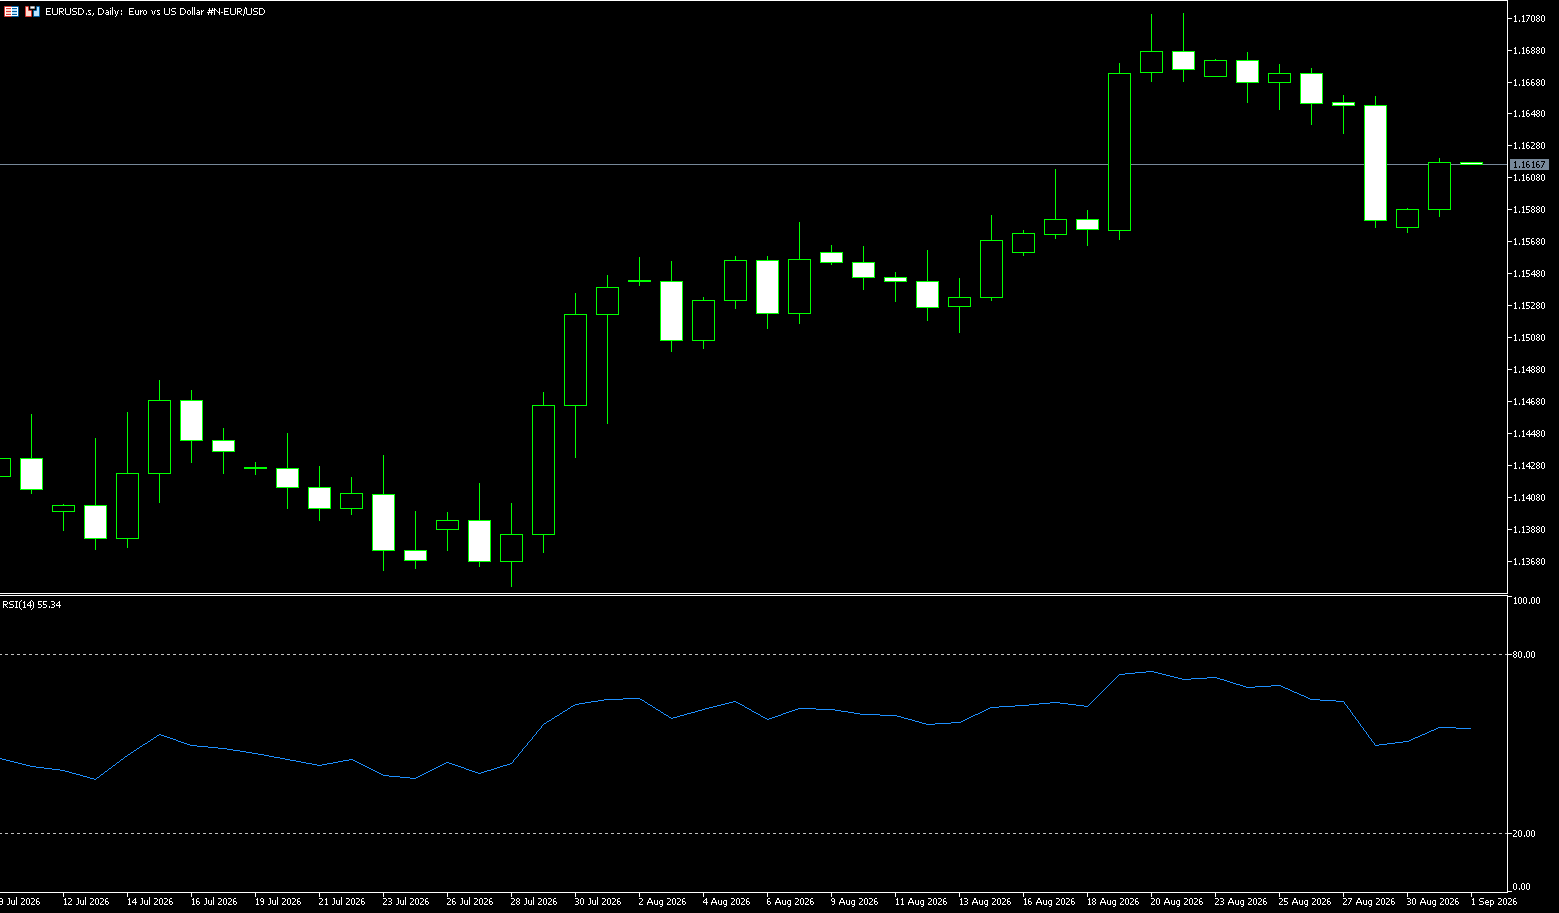
The euro rebounded against the dollar at the start of the week to around 1.1610, as European data pointed to renewed inflationary pressures. In his first major speech since becoming president in May, Warsh warned that inflation had not slowed significantly and that policymakers needed clearer evidence that price pressures were easing, otherwise the Fed still had "work to do." Meanwhile, inflation data from France and Spain strengthened market expectations for further tightening by the ECB. France's EU-wide inflation rate rose to 2.7%, while Spain's rose to 4.5%, the latter's highest level since 2023. Markets now expect the European Central Bank's deposit rate to rise to 2.80% next March, from the current 2.25%, with approximately a 60% probability of a hike to 3%. Recent ECB meeting minutes and Reuters reports also suggest a possible rate hike in September, although policymakers remain reluctant to signal further tightening.
On the daily chart, the euro/dollar pair maintains a slightly bullish short-term tone, holding above the 100-day simple moving average at 1.1570 and the lower Bollinger Band at 1.1479, while approaching the Bollinger Band middle line at 1.1593, which acts as a nearby pivot. The 14-day Relative Strength Index (RSI) is at 54, slightly above neutral, suggesting that directional momentum has slowed but remains slightly upward rather than indicating overbought conditions. On the upside, near-term resistance is at the 20-day Bollinger Band midline at 1.1593, with stronger resistance near the 200-day simple moving average at 1.1633, where a rebound could extend to 1.1711 (the previous high). On the downside, initial support is at the 100-day simple moving average at 1.1570, with further support at the more significant bearish trigger level around the psychological level of 1.1500. A daily close below this lower band would weaken the current constructive bias and open the way for a deeper correction.
Consider going long on Euros today at 1.1605, with a stop-loss at 1.1595 and targets at 1.1640 and 1.1650.
Stock Analysis:
Australian ASX 200 Stock Index
Basic Market Overview:
The Australian Securities Exchange (ASX) 200 index fell 16 points, or 0.2%, to close at 9,076 on Monday, the last trading day of August, reversing earlier gains, as US stock index futures fell after oil prices surged following a new round of US strikes on Iranian rocket launchers near the Strait of Hormuz. Hawkish comments from Federal Reserve Chairman Warsh exacerbated tensions surrounding interest rate hikes. Locally, Australian private sector credit grew by 0.6% in July, the lowest level in five months. Meanwhile, despite a rebound in manufacturing output, service sector activity with major trading partner China remained weak in July. Losses in technology, non-energy mining, and consumer goods stocks offset strong performance in communications and financial stocks.
Heavyweights BHP Billiton and Rio Tinto each fell by more than 2%, while Northern Star Resources and Evolution Mining each declined by 5.2%. Star Entertainment fell 3.9% despite narrowing its annual loss. In contrast, the four major banks rose. The index recorded its fifth consecutive monthly gain, rising 1.1%, driven by bargain hunting. Traders are now focused on second-quarter GDP and July trade data later this week.
Sector Performance:
Leading Sectors: Financials (Banking), Consumer Staples, Telecommunications Services; All four major banks rose (NAB/WBC rose over 2%), with safe-haven funds flowing into bank stocks to hedge against the risk of falling commodity prices.
Leading Sectors: Materials (Mining), Gold Mining, Technology; BHP and Rio Tinto fell over 2%, gold mining stocks generally fell 4%–5% (Northern Star, Evolution Mining), Xero and WiseTech weakened.
Technical Analysis:
The ASX200 index closed at 9076 points on Monday, down 16 points (-0.20%), with an intraday range of 9055–9108. August closed with a monthly gain of approximately 1.1%, marking the fifth consecutive month of gains, but the index fell back at the close, indicating weakening bullish momentum. Intraday Characteristics: The market initially rallied in the morning but weakened in the afternoon due to rising US Treasury yields and geopolitical risks. Market sectors showed significant divergence, with banks providing support while resource and gold mining stocks suffered sharp declines. The index encountered resistance near 9100, failing to hold above the upper range and retracing to test short-term support at 9050. It closed in a neutral range, shifting from a slightly bullish to a consolidation pattern in the short term. Market Characteristic: A high-level consolidation and shakeout; the medium-term upward trend remains intact, but short-term catalysts for further upward movement are lacking.
Tuesday (September 1st) Technical Outlook: Baseline Scenario: Primarily range-bound trading (9000–9110). Without significant overseas positive news, Tuesday is likely to see continued sector rotation, with index volatility not expected to be extreme. Bullish Trigger: A firm hold above 9110, momentum recovery, and a target of 9150. Bearish trigger: A decisive break below 9050 and a close below that level would test 9000; if 9000 is breached, the market will enter a short-term correction. The index is close to the 20-day moving average, with the 50-day moving average forming a medium-term support zone; the short-term upward slope is flattening, indicating weakening upward momentum. Momentum indicators: RSI has fallen from a high level to the neutral range (48-52), MACD histogram is narrowing, indicating weakening upward momentum and a balance between bulls and bears; the trading volume is not showing a significant increase during the sell-off, suggesting a profit-taking pullback rather than a major trend decline.
Trading Strategy:
Short-term Trading Strategy (Intraday - 3-day perspective)
1. Long Opportunities (Optimistic Scenario): Consider a small long position if the price retraces to 9050-9060 and stabilizes, or if SPI futures strengthen; place a stop-loss below 9040; first target is 9100, with a break above targeting 9140-9150.
2. Short Selling Opportunity (Cautious Scenario): A rebound to 9100-9110 followed by a pullback presents a small shorting opportunity; place a stop-loss above 9120; first target is 9050, with a further target of 9000 if it breaks below.
Key Risk Warnings:
1. External Macroeconomic Risks: Hawkish statements from the Federal Reserve push up US Treasury yields, directly suppressing Australian growth and resource stocks; Middle East geopolitical conflicts disrupt oil prices and risk appetite, and overnight US stock/futures movements will have a significant impact on the Australian stock market opening.
2. Domestic and Chinese Demand Risks: Weak recovery in China's manufacturing and service sectors directly suppresses commodity prices such as iron ore and copper; fluctuations in heavyweight stocks like BHP and Rio Tinto will significantly influence the index. Australia will release GDP and trade data this week, which could easily trigger a gap in price action.
3. Structural Risks: The ASX200 is highly dependent on the banking and mining sectors. Fluctuations in these heavyweight stocks can distort the index. In a market with sector divergence, the index may fluctuate slightly, but individual stock gains and losses can vary significantly.
Japan Stock Market Index (JP225)
Basic Market Overview:
The Nikkei 225 fell 0.14% to close at 66,312 points, while the broader Topix index rose 0.23% to close at 4,156 points. Market expectations for a September US rate hike recovered on Monday, stimulated by hawkish comments from Federal Reserve Chairman Kevin Warsh, but this recovery lacked momentum. In his Jackson Hole speech on Friday, Warsh warned that inflation had not slowed significantly and reiterated the Fed's commitment to restoring inflation to its 2% target, while noting that current financial conditions were not tight. Market sentiment was also pressured by soaring oil prices following the US military's strike on Iranian rocket launchers preparing to deploy mines in the Strait of Hormuz. Domestic data showed that Japanese industrial production unexpectedly increased in July, while retail sales grew more than expected.
Most technology stocks declined, with Advantest down 4.5%, Terra Drone down 17.8%, Murata Manufacturing down 2.8%, and Disco Corp down 2.1%. This month, the Nikkei and Topix indices rose 3.03% and 3.82%, respectively.
Sector Performance:
Leading Sectors
Electricity & Gas: Defensive utilities, safe-haven buying drove strength in heavyweight stocks like Kansai Electric Power.
Mining/Oil & Coal Products: Resource cyclical stocks rebounded, with Tokai Carbon surging 7.7%.
Non-ferrous Metals & Chemical Materials: Valuation repair, low-priced cyclical stocks saw capital inflows.
Retail Consumption: Some domestic consumer stocks showed slight resilience.
Leading Sectors
Semiconductors/Electronic Equipment (Technology Weighting): Weakness in US tech stocks overnight dragged down the market.
Tokyo Electron -3.24%; Murata Manufacturing -2.8% (Trading EC...)
Air Transport & Shipping: Profit-taking in the transportation sector.
Securities & Futures & Finance: Rising long-term bond yields suppressed brokerage valuations.
Heavy Industry Raw Materials: Mitsubishi Materials -6.57%, Japan Steel Works -5.61% were among the biggest losers.
Technical Analysis:
The Nikkei 225 closed at 66,311.93 on Monday, a slight decrease of 0.14% (-93.63). (Point) Intraday Movement: The market opened lower due to rising US Treasury yields and a pullback in US tech stocks, experiencing a rapid decline of over 1500 points at its peak. Late in the session, buying pressure at lower levels significantly narrowed the losses, resulting in a long lower shadow doji candlestick, indicating short-term support, but the bulls have not yet launched a counterattack. Market Sentiment Summary: This is a stabilization and recovery after a sharp drop, with short-term selling pressure released, but the medium-term outlook remains weak and volatile, lacking clear reversal signals. The market's movement is highly dependent on US stocks, US Treasury yields, and the USD/JPY exchange rate.
Tuesday's Outlook: This is a corrective move from the previous high, with the 50-day moving average acting as resistance. Monday's long lower shadow indicates short-term oversold rebound momentum, but the MACD has not yet formed a golden cross, and the RSI is in the neutral range, suggesting an overall range-bound trading pattern with no clear directional trend. 2.4-Hour Chart: 64830 forms a short-term support level; holding this range maintains the low-level rebound structure; a break below this level will allow bears to dominate again. Two scenarios are anticipated: Optimistic Scenario: A firm hold above 64830 will test the 66700-67000 resistance level. A break above 67000 with significant volume could open up a rebound to around 67800. Pessimistic Scenario: A break below 64830 support will target 64300, with the weakness continuing and retracing to lower levels.
Trading Strategy:
Short-Term Trading Strategy (Intraday - Next-Day Short-Term)
Bullish Outlook (Playing for a Low-Level Rebound)
• Consider going long only if the price retraces to the support range of 64,900-65,200 and stabilizes with a small positive candle.
• Stop Loss: Below 64,750
• First Take Profit: 66,500-66,700; Second Take Profit: 67,600-67,800 It is not recommended to chase the price higher at the open; prioritize waiting for a retracement to confirm support.
Short-selling strategy (sell on rallies)
• Consider shorting when the price rallies to the 66,700-67,000 range and encounters resistance with an upper shadow.
• Stop loss: Above 67,150
• First take profit: 65,300; Second take profit: 64,850
Key risk warnings:
1. External macroeconomic risks: US interest rate expectations and fluctuations in US Treasury yields directly suppress Japanese technology stocks; overnight US PMI data may trigger overnight volatility in US stocks, potentially leading to a gap-down opening for Japanese stocks the following day.
2. Currency risk: Significant fluctuations in the USD/JPY exchange rate, with rapid yen appreciation exerting significant downward pressure on the Nikkei index.
3. Sector black swan events: Performance and news disruptions in leading AI semiconductor stocks can easily cause sharp fluctuations in heavyweight stocks, amplifying index volatility.
Disclaimer: The information contained herein (1) is proprietary to BCR and/or its content providers; (2) may not be copied or distributed; (3) is not warranted to be accurate, complete or timely; and, (4) does not constitute advice or a recommendation by BCR or its content providers in respect of the investment in financial instruments. Neither BCR or its content providers are responsible for any damages or losses arising from any use of this information. Past performance is no guarantee of future results.
More Coverage






2026 © - All Rights Reserved by BCR Co Pty Ltd
Risk Disclosure:Derivatives are traded over-the-counter on margin, which means they carry a high level of risk and there is a possibility you could lose all of your investment. These products are not suitable for all investors. Please ensure you fully understand the risks and carefully consider your financial situation and trading experience before trading. Seek independent financial advice if necessary before opening an account with BCR.
Jurisdiction Notice:Our services are not intended for residents of the United States & Canada, and we do not intend to distribute or use the provided information in any country or jurisdiction where it would be contrary to local law or regulation. It is important that you read and consider the relevant legal documents associated with your account, including the Terms and Conditions issued by BCR before you start trading. BCR Co Pty Ltd is regulated by the British Virgin Islands Financial Services Commission, Certificate No. SIBA/L/19/1122. The Registration Number in the BVI is 1975046. The Registered Address of the Company is Trident Chambers, Wickham’s Cay 1, Road Town, Tortola, British Virgin Islands.
BCR Co Pty Ltd (Company No. 1975046) is a company incorporated under the laws of the British Virgin Islands, with its registered office at Trident Chambers, Wickham’s Cay 1, Road Town, Tortola, British Virgin Islands, and is licensed and regulated by the British Virgin Islands Financial Services Commission under License No. SIBA/L/19/1122.
Open Bridge Limited (Company No. 16701394) is a company incorporated under the Companies Act 2006 and registered in England and Wales, with its registered address at Kemp House, 160 City Road, London, England, EC1V 2NX. Open Bridge Limited acts solely as a payment processor for BCR Co Pty Ltd and does not provide any financial, trading, or investment services on its behalf. Open Bridge Limited's role is limited to payment processing.


 English
 简体中文
简体中文
 繁體中文
繁體中文
 Bahasa
Melayu
Bahasa
Melayu
 Tiếng
Việt
Tiếng
Việt
 ไทย
ไทย
 日本語
日本語
 한국어
한국어
 ភាសាខ្មែរ
 español