


0
Currency & Commodity Analysis:
US Dollar Index
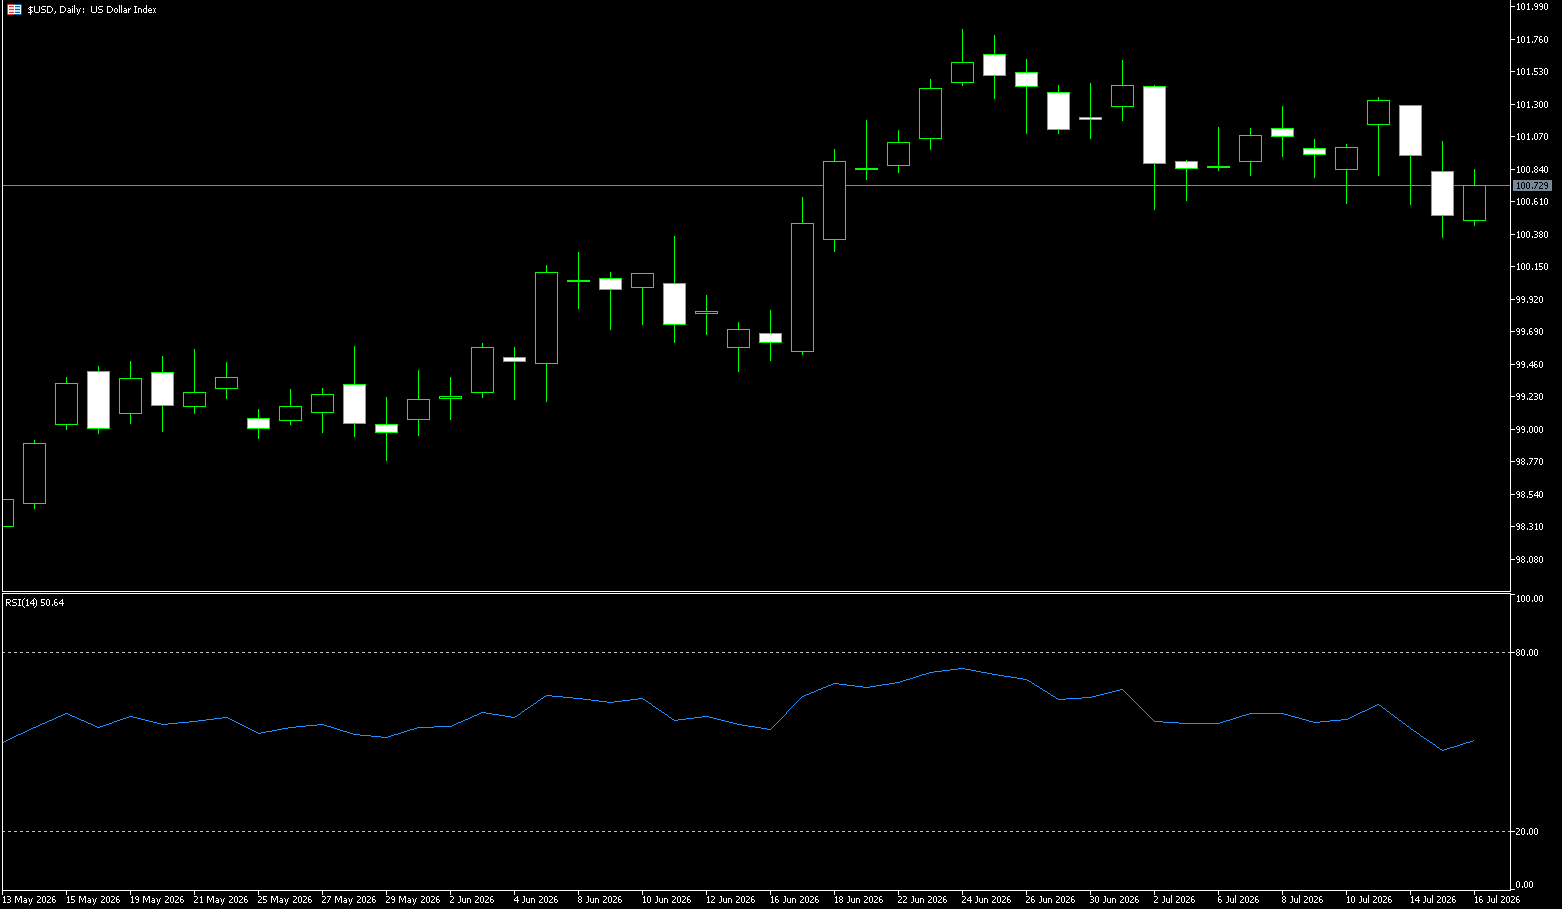
The US dollar index rose to 100.70 on Thursday, rebounding after two days of decline, as investors assessed the latest economic data showing continued resilience in the US economy. Retail sales met expectations, lower gasoline prices impacted gas station revenue, and sales at auto dealerships and non-store retailers were strong. Meanwhile, initial jobless claims fell to 208,000, a two-month low. The market also continues to focus on developments in the Middle East, with oil prices hovering near a one-month high after the US escalated its attacks on Iran. Against this backdrop, the market currently expects a 12% probability of a Fed rate hike this month and a 56% probability of a September rate hike. The dollar has mostly risen against the pound and the euro.
The dollar index is facing three forces in the short term. First, both CPI and PPI are lower than expected, reducing the urgency for consecutive rate hikes. Second, upstream metal prices remain high, making it difficult for the Fed to quickly shift to easing. Third, the Middle East conflict has a dual impact on oil prices, inflation expectations, and safe-haven demand, potentially increasing demand for the dollar and pushing up long-term inflation risks. The MACD indicator shows the DIFF at 0.2680, lower than the DEA at 0.3584, indicating weak rebound momentum and a current closer to range rebalancing than trend confirmation. Therefore, the area around 100.36 (Wednesday's low) to 100.00 (a psychological level) represents a support zone after recent data shocks, while the area around 100.90 (the 9-day moving average) to 101.00 (a psychological level) corresponds to previous rebound highs and areas of dense trading. The current US dollar index is not simply trading on "falling inflation," but rather assessing whether the rate of decline can offset cost channels and risk premiums.
Consider shorting the US dollar index today at 100.84, with a stop loss at 100.95 and targets at 100.40 and 100.30.
WTI Crude Oil
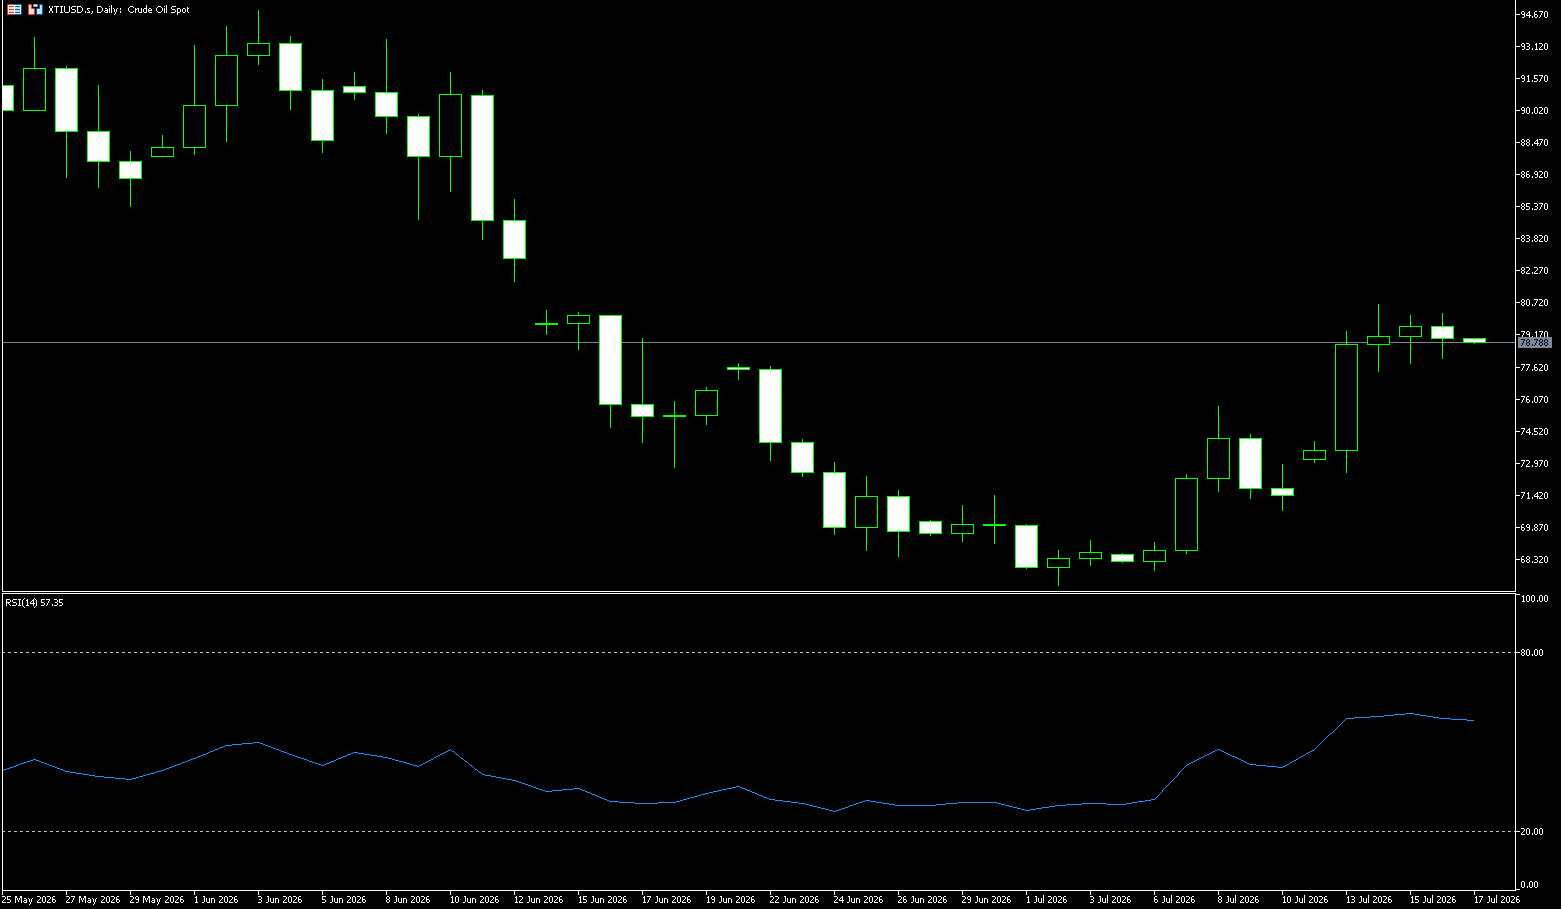
US crude oil is trading slightly below $80.00 per barrel. Despite a new round of US airstrikes on Iranian military facilities to limit its ability to strike shipping in the Strait of Hormuz, and the Iranian Revolutionary Guard threatening to close more important export routes, the market has not been overly affected by the escalation of hostilities in the Middle East. Furthermore, the smaller-than-expected decline in US crude oil inventories has limited the price increase. The U.S. Energy Information Administration (EIA) reported that U.S. crude oil inventories fell by 1.7 million barrels last week, less than the market expectation of 2.6 million barrels, while distillate fuel inventories surged by 4.6 million barrels (compared to an expected increase of only 100,000 barrels), indicating that supply has not disappeared rapidly but has stabilized. However, geopolitical risks continue to escalate—the U.S. military struck dozens of military targets near the Strait of Hormuz overnight, while Iran retaliated against U.S. targets in Bahrain, Kuwait, and Jordan. Goldman Sachs estimates that Gulf region crude oil exports fell to less than 50% of pre-war levels last week (approximately 11 million barrels per day) and warned that if the recovery momentum of exports continues to stall, WTI oil prices could break through $100 in the fourth quarter.
Currently, the crude oil market is extremely polarized between bullish and bearish expectations, clearly outlining the boundaries of future oil price movements. If the U.S.-Iran stalemate continues, Gulf region oil and gas exports stagnate, production recovery is further delayed, and geopolitical risks continue to escalate, WTI crude oil prices are expected to break through $100 per barrel in the fourth quarter of 2026. Conversely, if the US-Iran situation eases and the conflict de-escalates, coupled with high global fuel retail prices suppressing energy demand and a stronger-than-expected recovery in market capacity, demand recovery will be weak, and WTI crude oil prices may fall back to the $60/barrel range by the end of the year. Currently, every escalation and easing of geopolitical tensions will directly dominate the short-term price fluctuations of crude oil. Technically, oil prices have stabilized above the 0.382 Fibonacci retracement level of $79.57 and broken through the downtrend line. If oil prices hold above this level, a further rebound is expected. Current resistance is near the previous downward gap at $82.36 and the 0.500 Fibonacci retracement level at $85.69. Meanwhile, the 5-day moving average at $77.55 and the 9-day moving average at $74.95 still need to be tested.
Today, consider going long on crude oil at 78.75, with a stop-loss at 78.60 and targets at 80.00 and 81.00.
Spot Gold
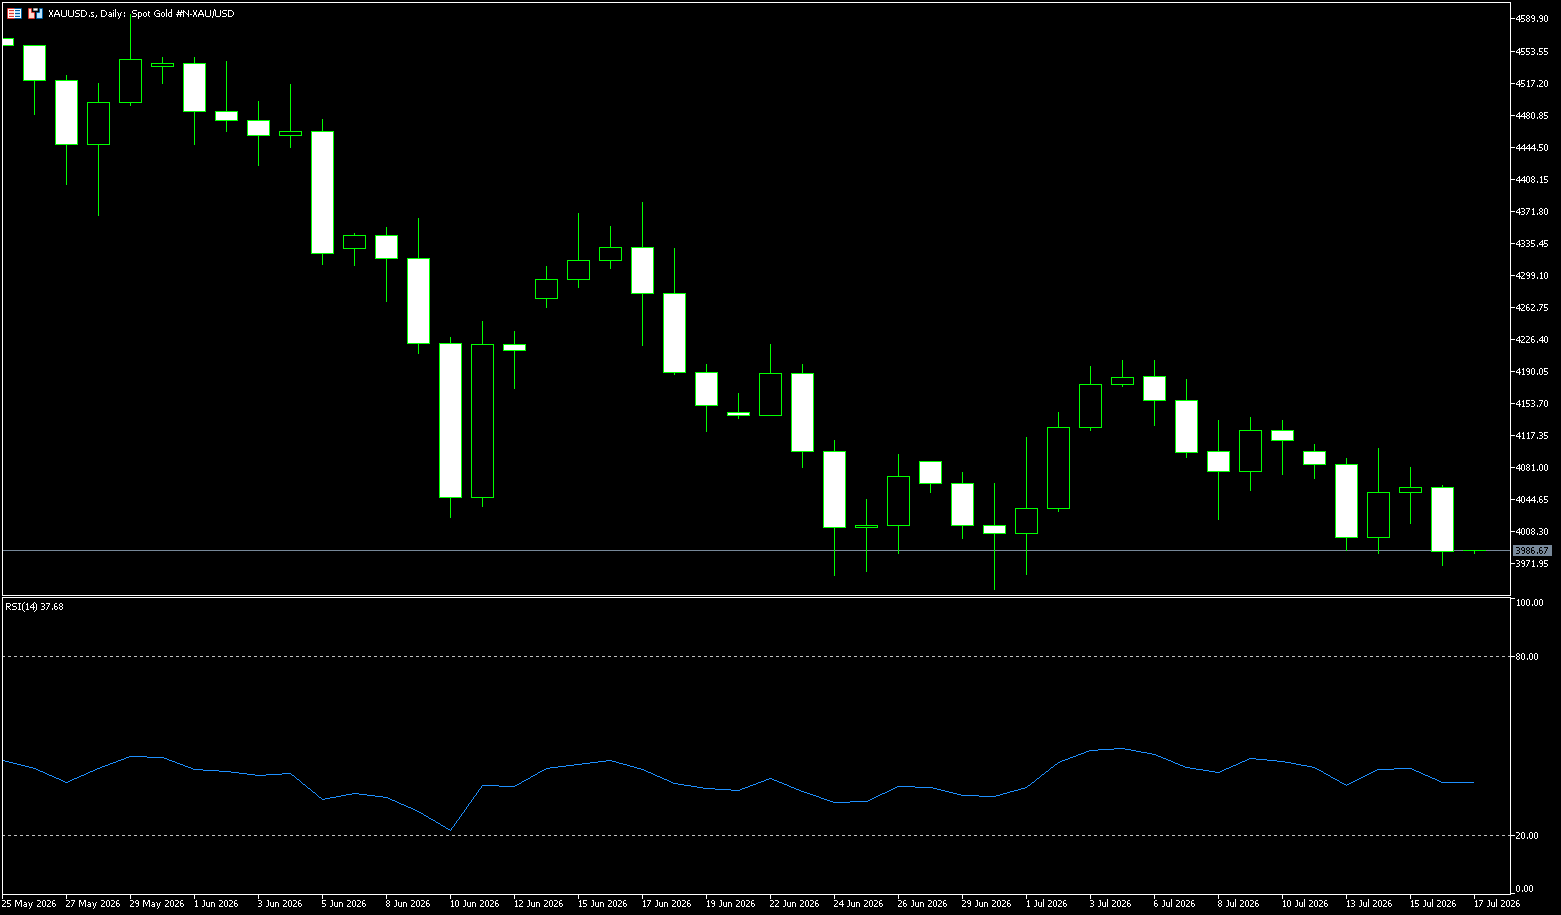
Gold prices fell to near $4,000 per ounce on Thursday, close to their lowest level since November 2025, as escalating tensions in the Middle East pushed oil prices higher and exacerbated concerns that interest rates might remain high. The latest escalation was due to a new round of US strikes on Iranian military targets and Tehran's retaliation against US bases in neighboring countries, increasing concerns about the security of the Strait of Hormuz and pushing oil prices to a one-month high. The rise in energy prices strengthened market expectations that the Federal Reserve may need to maintain its tight monetary policy for longer, reducing the appeal of non-yielding gold. Traders currently expect a roughly 51% probability of a rate hike in September. Meanwhile, weaker-than-expected US inflation data released this week largely ruled out a July rate hike, even though Fed Chairman Kevin Warsh reiterated his commitment to controlling inflation.
In summary, the strength of alternative assets is a major reason for the limited rebound in gold buying. If this situation continues, it will be difficult for gold to see sustained strong buying, and the price is likely to continue to fluctuate in direction. The downtrend line remains crucial: although gold prices have attempted to rebound several times recently, the upward momentum is insufficient compared to the daily downtrend structure established in early March 2026. This downtrend line remains the primary technical level to watch; however, if gold prices do not make new lows, a neutral consolidation pattern may weaken the bearish trend, and the price is likely to enter a sideways trading range. The Relative Strength Index (RSI) is near below 45, indicating that the bullish and bearish forces have been relatively balanced over the past 14 trading days, and the market is facing a dilemma. If the indicator remains in its current state, the consolidation pattern of gold prices will continue. The MACD histogram is close to the zero line, and the short-term moving averages are evenly matched, further confirming that the price is likely to enter a consolidation phase. On the downside, initial support is at $3.941.70 (the low at the end of June), followed by $3,900 (the psychological level). On the upside, the 20-day simple moving average is at $4,084, with a further target of $4,120 (the 25-day simple moving average).
Consider going long on gold today at $3,955, with a stop-loss at $3,950 and targets at $4,000 and $4,010.
AUD/USD
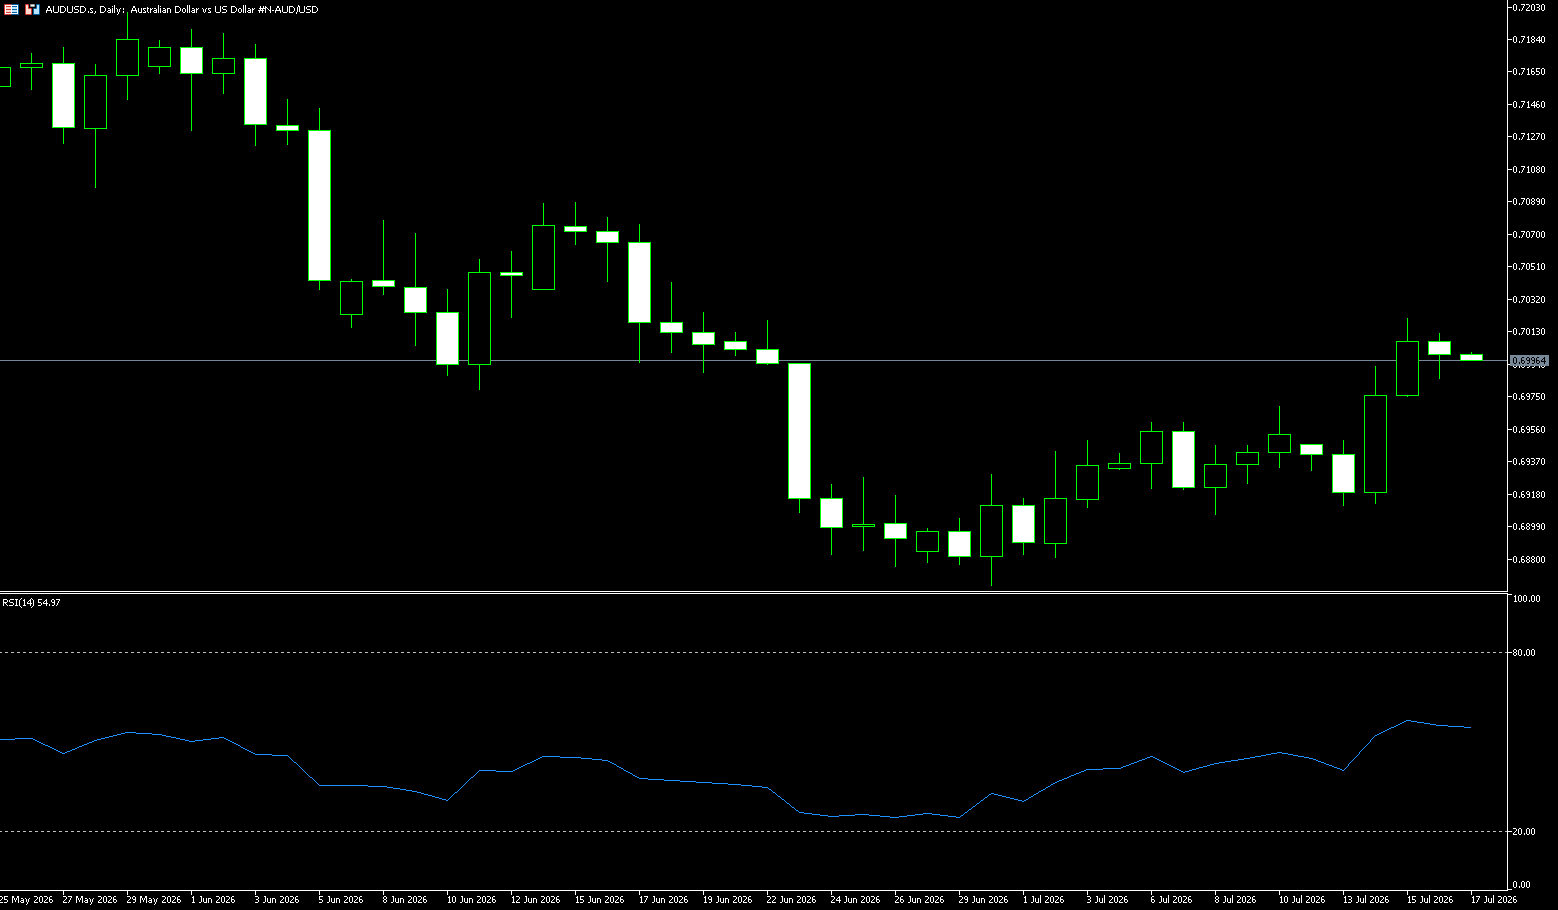
The Australian dollar appreciated to around US$0.7021, reaching its highest point in three weeks, as weaker-than-expected US inflation data pressured the dollar and reduced market expectations for further Fed rate hikes. Investors also disregarded renewed tensions between the US and Iran after President Trump threatened additional strikes and a reinstatement of the US blockade of Tehran, focusing instead on Washington's decision to abandon proposed tariffs on goods transiting the Strait of Hormuz, which improved risk sentiment. In Australia, expectations for further policy tightening remain subdued following the Reserve Bank's three rate hikes since February. The market currently only prices a 20% probability of a rate hike in August and approximately a 60% probability by December. Meanwhile, recent business surveys showed that operating conditions remained weak in June, cost pressures eased somewhat, and consumer confidence improved slightly in July, despite the challenge of rising fuel prices.
On the daily chart, the Australian dollar is trading around 0.7000 against the US dollar, continuing to lie below the 50-day moving average at 0.7057 and the 100-day simple moving average at 0.7063. Although the 200-day simple moving average at 0.6876 provides support, it is limiting the pair's upside in the short term. The 14-day Relative Strength Index (RSI) is at 51.40, remaining largely neutral, while the Average Directional Index (ADX) at a moderate reading of around 31 suggests that the overall trend remains active, but the latest rally lacks strong momentum to challenge the cluster of moving averages above. On the upside, initial resistance is located at the 50-day moving average at 0.7057 and the 100-day simple moving average at 0.7063, forming a dense upper resistance zone slightly above the current price; higher resistance is seen at the psychological level of 0.7100. On the downside, if the US-Iran conflict continues to escalate, further deterioration in risk appetite could push the Australian dollar to test the 0.6900 or even 0.6876 (200-day moving average) area.
Consider going long on the Australian dollar today at 0.6980, with a stop loss at 0.6970 and targets at 0.7030 and 0.7040.
GBP/USD
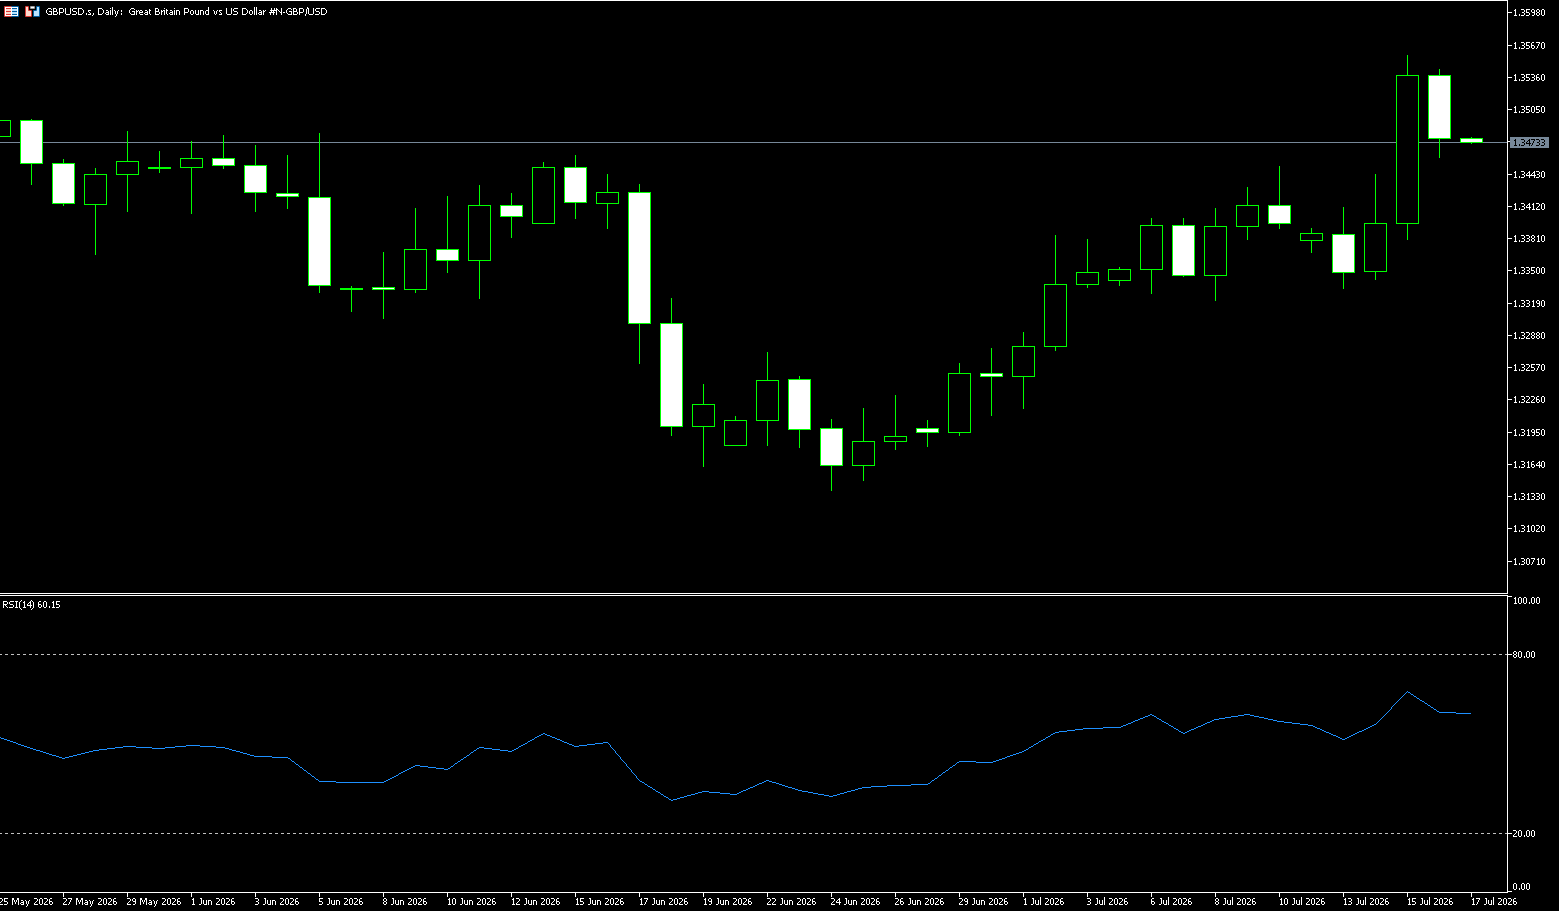
On Thursday, the pound/dollar pair gave back some of Wednesday's gains, falling more than 0.48% after strong US data was released. This sell-off occurred amid rising risk aversion in the market, enhancing the appeal of the safe-haven dollar. At the time of writing, the pound/dollar was trading at 1.3477, having previously approached a high of 1.3545. Strong initial jobless claims data and geopolitical factors boosted the dollar, causing the pound/dollar to decline. US retail sales rose 0.2% month-on-month in June, in line with expectations. Gasoline prices fell from $4.61 in May to $4.18 last month, giving consumers more funds for non-essential spending. Excluding gasoline and automobiles, retail sales rose 0.4% month-on-month, below 0.5%. Escalating tensions in the Middle East could boost safe-haven currencies such as the dollar and put pressure on the major currency pair in the short term. Traders increased their bets on a Bank of England rate hike this year due to the expected impact of rising oil prices on inflation.
The daily chart shows that after rebounding from a low of 1.3139, the British pound against the US dollar briefly rose above the psychological level of 1.3500. The MACD DIFF is 0.0008, higher than the DEA of -0.0007, and the histogram remains positive, indicating that the short-to-medium-term recovery momentum remains. However, the 1.3580 level (Wednesday's high) and the 1.3600 level constitute the most concentrated area of technical resistance. The 14-day Relative Strength Index (RSI) is hovering above 65, and the Moving Average Convergence Divergence (MACD) is in positive territory. However, the aforementioned psychological level of around 1.3600 may be a difficult barrier to break through. The first support level to watch is the 300-day simple moving average at 1.3432, which may pose a challenge to the bears. The psychological level of 1.3432 will be the next target.
Today, consider going long on GBP at 1.3466, with a stop-loss at 1.3455 and targets at 1.3520 and 1.3530.
USD/JPY
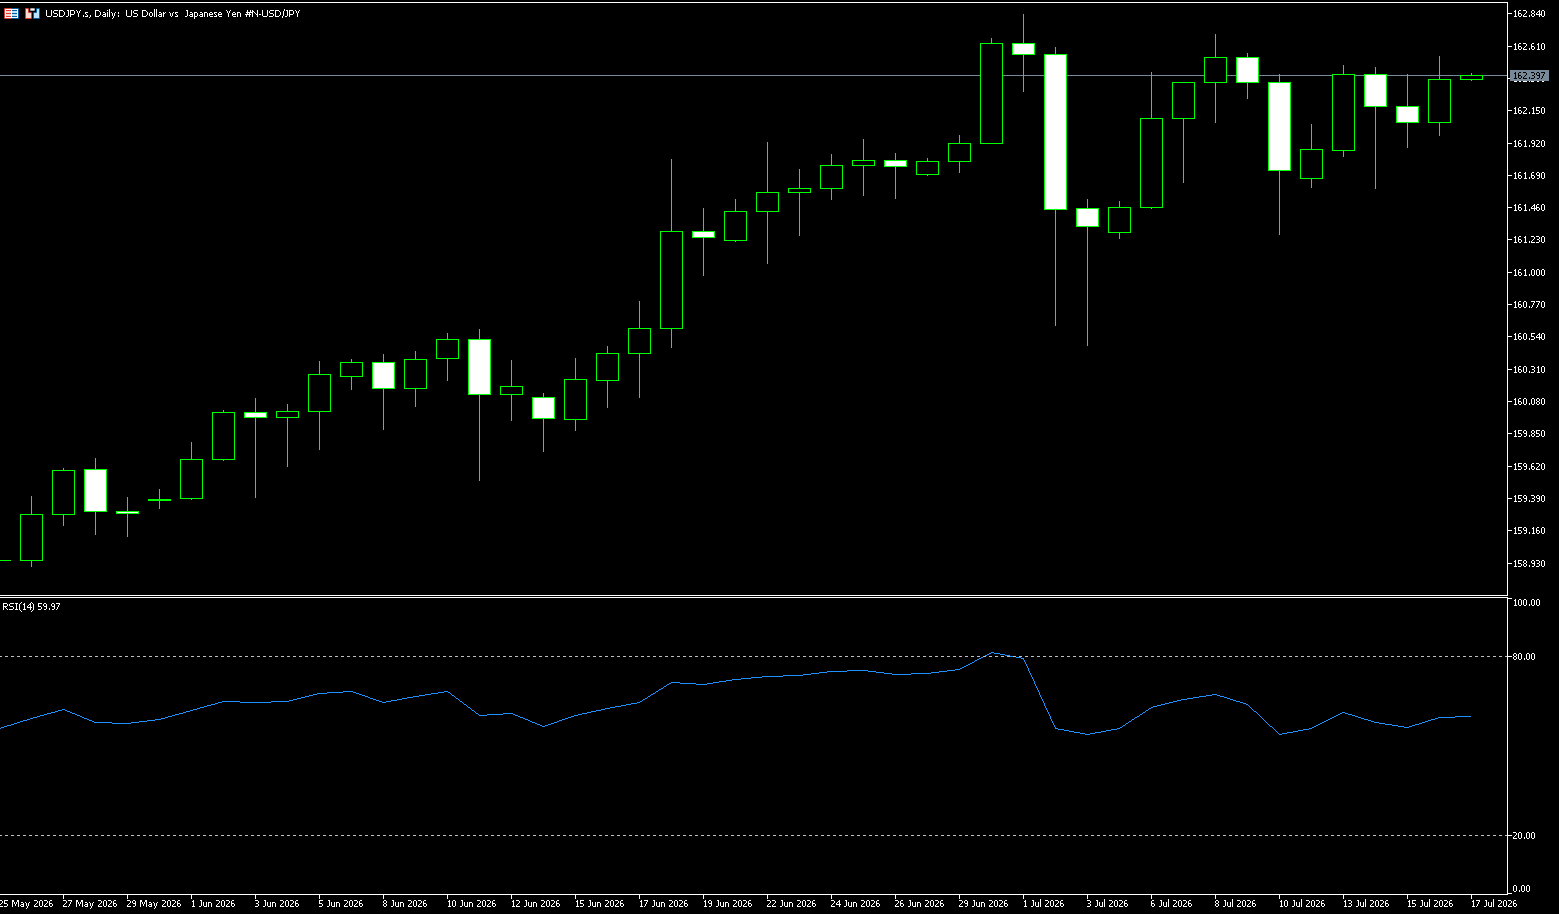
The yen stabilized around 162 per dollar on Thursday, supported by a weaker dollar after lower-than-expected US inflation data eased concerns about an imminent Fed rate hike. However, the outlook remains uncertain amid escalating geopolitical tensions in the Middle East, with oil prices rising after the US imposed additional strikes on Iran and reinstated its blockade of Tehran in the Strait of Hormuz. In Japan, data showed a larger-than-expected decline in machinery orders in May, highlighting broad-based weakness in business investment. Despite a slight rebound, the yen remains near 40-year lows as Tokyo lacks concrete measures to bolster the currency. A recent report also noted that Japan has no immediate plans to adjust the asset allocation of its national pension fund, reducing expectations for short-term support for domestic assets.
The persistent interest rate differential between the US and Japan continues to support USD/JPY. Despite the market lowering its expectations for a near-term Fed rate hike, US interest rates remain significantly higher than Japan's, making carry trades still attractive. This factor limits the yen's potential for further appreciation and makes the market cautious when positioning short USD/JPY. Technically, USD/JPY maintains a high-level consolidation and pullback structure on the daily chart, with short-term bullish momentum weakening. Current resistance levels to watch are 162.84 (July 1st high) and the 163.00 (psychological level), with further resistance around 163.50. On the downside, the 30-day exponential moving average at 161.45 provides initial intraday support, followed by the 161 level. Weakening daily momentum indicators suggest the market has entered a short-term correction phase.
Today, consider shorting the US dollar at 162.55, with a stop-loss at 162.70 and targets at 161.70 and 161.60.
EUR/USD
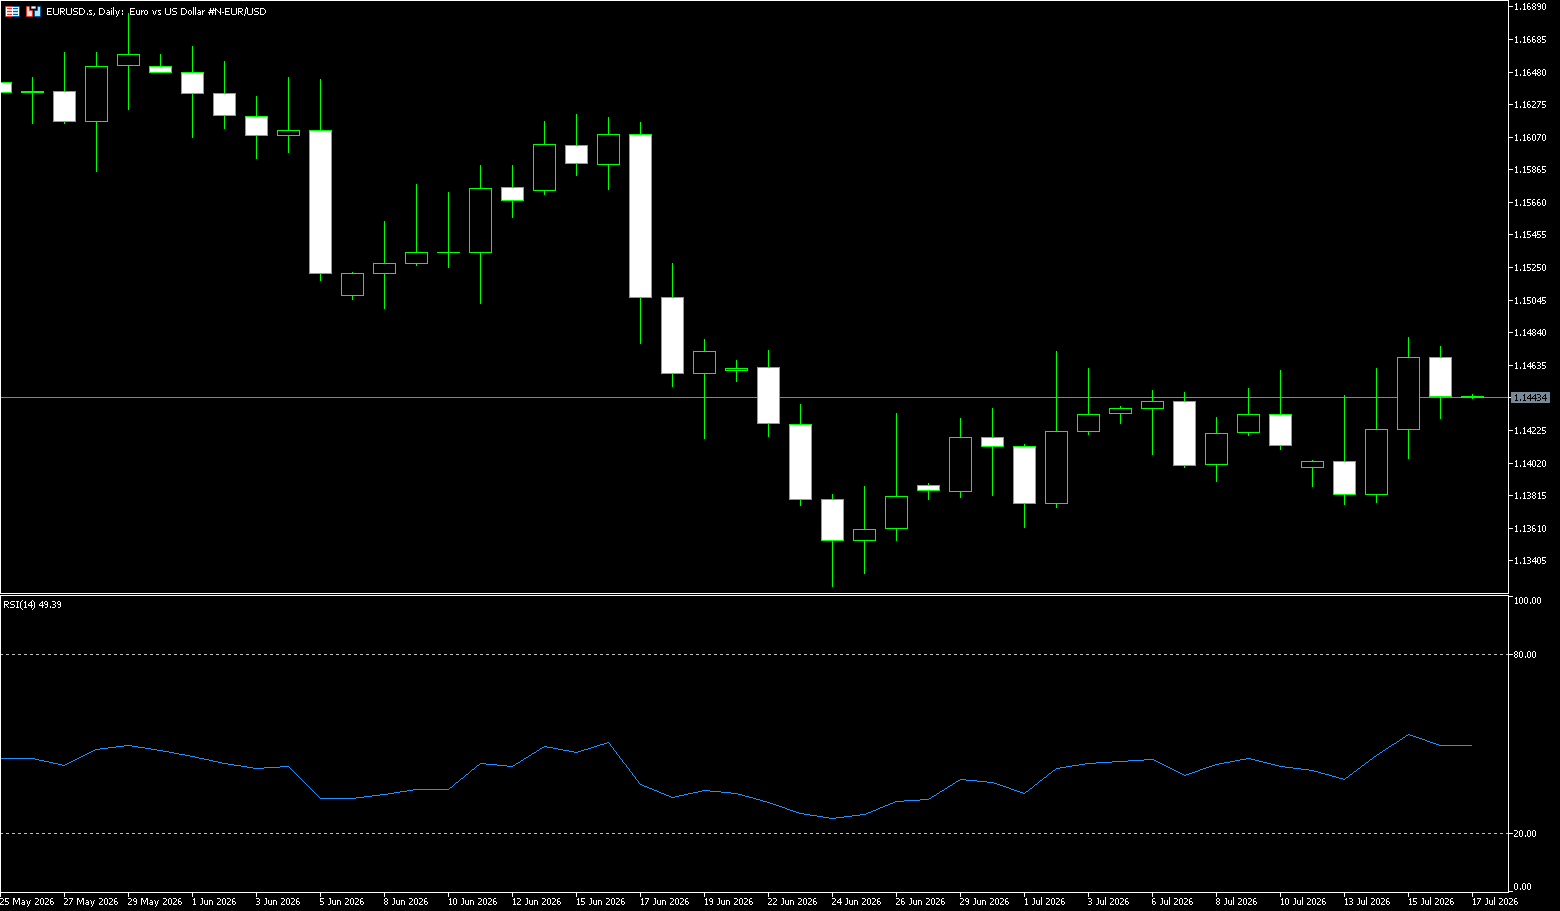
On Thursday, EUR/USD held steady above 1.1420, consolidating its strong gains over the past two days, reaching its highest level since June 18. The dollar struggled to attract any meaningful buying and hovered near a four-week low, reached after Wednesday's US Producer Price Index (PPI) release. Indeed, the US Bureau of Labor Statistics reported an unexpected 0.3% decline in the June PPI. This, coupled with Tuesday's weak CPI report, further prompted traders to reduce their bets on an immediate Fed rate hike. This outlook, in turn, put dollar bulls on the defensive and was seen as a key factor supporting EUR/USD. Furthermore, the US maritime blockade of Iranian ports and the closure of the Strait of Hormuz supported oil prices remaining high. This exacerbated concerns about energy-driven inflation and reignited hawkish expectations from the Fed, limiting the dollar's decline and weighing on EUR/USD.
On the daily chart, the euro/dollar pair has been consolidating sideways after rebounding from its June 24 low of 1.1324. The latest price is around 1.1460, after reaching a near one-month high of 1.1482. 1.1482 and 1.1478 (the Bollinger Band) form strong resistance levels, while 1.1377 is the low from this week's pullback. The pair's repeated consolidation around the middle Bollinger Band indicates that the rebound has not yet translated into a trend correction. Regarding the MACD indicator, it shows weakening downward momentum, but both lines remain below the zero line, which cannot be equated with a medium-term trend reversal. The technical and fundamental signals are highly consistent: the market accepts the possibility of continued tightening by the ECB, but is not yet convinced that the energy shock will further erode growth. The 1.1500 to 1.1528 (June 18 high) area reflects whether the policy premium can outweigh the growth discount, while the 1.1377 to 1.1324 area corresponds to the strength of support should risk appetite and growth expectations deteriorate again.
Today, consider going long on the Euro at 1.1420, with a stop loss at 1.1410 and targets at 1.1470 and 1.1480.
Stock Analysis:
Australian ASX 200 Stock Index
Basic Market Overview:
The Australian Securities Exchange (ASX) 200 index closed flat at 8,841 points on Thursday, giving back gains from the morning session as strong performance in consumer goods, utilities, and consumer services offset weakness in technology and energy stocks. Traders assessed Australian consumer inflation expectations, which fell to a six-month low of 4.7% in July, although underlying inflation remained stubbornly above the Reserve Bank of Australia's 2-3% target range. Meanwhile, US President Trump and Chinese leader Xi Jinping are expected to meet at the end of September, just before the current trade truce expires, according to sources including US Trade Representative Jamison Greer.
On the other hand, US stock index futures rose slightly, easing market expectations of an imminent Federal Reserve rate hike, influenced by weak US inflation data. BHP Billiton fell 2.2% after reporting weak quarterly copper production. Meanwhile, Rio Tinto fell 0.9%, erasing gains from the previous session. In contrast, the four major banks rose between 0.3% and 1.5%, while Reece rose 2.3%, ASX Limited rose 2.2%, and WiseTech Global rose 2.0%.
Sector Performance:
Leading Sectors (from highest to lowest gain)
1. Communication Services (XTJ) +1.28% [Strongest performer overall] Defensive sectors saw capital inflows, with Telstra and TPG Telecom strengthening, recovering from the previous trading day's losses.
2. Consumer Discretionary (XDJ) +1.10% REA Group's significant rise boosted real estate services, media, and leisure retail sectors.
3. Financials (XFJ) +0.83% The four major banks (CBA, NAB, etc.) saw slight gains; AMP's better-than-expected earnings forecast significantly boosted the sector, with securities firms and insurance companies also strengthening.
4. Real Estate, Healthcare, Information Technology, and Industrials sectors saw slight gains.
Leading Declining Sectors (from largest to smallest decline):
1. Materials (XMJ) -1.56% [Weakest Performer]
Key drag: BHP's FY27 copper production guidance was lower than market expectations, causing a significant drop in its share price; Rio Tinto and iron ore-related stocks also weakened, putting pressure on base metal prices.
2. Energy (XJE) -1.58% Profit-taking pressured Woodside and Santos, and short-term upward momentum in international crude oil weakened.
3. Utilities (XUJ) -0.24%
Technical Analysis:
The ASX200 closed essentially flat at 8,840.7 points on Thursday, holding the key support level of 8,810-8,812. Gains in the banking sector offset the drag from resource stocks. Technically, the market is showing a slightly bullish trend with fluctuations. Short-term focus should be on the effectiveness of the breakout at 8,868 and the support at 8,810. The strategy should primarily be to buy on dips. Thursday's long lower shadow doji indicates strong buying pressure below, and the 8,810 area provides effective support. The index has been consolidating in the 8,750-8,870 range for nearly a week, exhibiting a typical "accumulation" pattern. It is only 3.94% away from the 52-week high of 9,200, indicating further upside potential, provided that the drag from resource stocks does not worsen. Technical indicators: RSI (14): Approximately 54-56, in a neutral-to-strong range, with no obvious overbought signal, indicating continued upward momentum; MACD (12,26): The DIFF line is close to the zero axis, and the histogram is slightly contracting, indicating short-term consolidation, awaiting a directional choice; The index is currently trading above the 5-day, 10-day, and 20-day moving averages, with a well-maintained short-term bullish alignment and solid medium-term support.
Trading Strategies:
The following are technical trading ideas only and do not constitute investment advice. Leveraged trading may result in losses exceeding the principal.
Short-Term Trading Strategies (Suitable for intraday/3-5 day swings)
Long Strategy
• Entry Timing: When the price retraces to the 8,810-8,815 point range, with decreasing volume and confirmed support.
• Target Price: First target 8,860 points, second target 8,880 points, with a further target of 8,900 points after a breakout.
• Stop-Loss: Below 8,790 points (below yesterday's low to avoid false breakouts).
• Preferred Sectors: Financials (CBA, MQG), Gold Stocks (Kingsgate, Ramelius), Consumer Staples (WOW)
Short Strategy
• Entry Timing: When the price rebounds to the 8,860-8,880 point range, with divergence between price and volume and insufficient upward momentum.
• Target Price: First target 8,830 points, second target 8,810 points. • If it breaks below 8,900, look for 8,790 points.
• Stop-loss setting: Above 8,900 points (above the psychological level, to control risk)
• Preferred sectors: Materials (BHP, RIO), Technology (XRO, WTC), Energy (Woodside)
Key Risk Warnings:
Mining stock volatility risk: The decline in heavyweight stocks such as BHP dragged down the index. If commodity prices continue to decline, the materials sector may weaken further.
Sector rotation risk: Today, financial and gold stocks led the gains, but funds may quickly shift, leading to missed opportunities or losses for those holding positions.
Insufficient volume risk: Thursday's trading volume was lower than the previous day, indicating limited upward momentum and a high risk of false breakouts.
NZX50 Index
Basic Market Overview:
The New Zealand Stock Exchange 50 Index fell 20 points, or 0.1%, to 13,616 points on Thursday, marking its fourth consecutive day of decline and reaching its lowest level since July 2nd. This was mainly dragged down by losses in the communications services, energy, consumer goods, and financial sectors. Investors continued to focus on developments in the Middle East conflict, while rising oil prices exacerbated inflation concerns and increased expectations for further interest rate hikes. Traders remained cautious ahead of Friday's June food inflation data, which showed a faster increase in May. On Tuesday, Reserve Bank of New Zealand Chief Economist Paul Conway warned that persistent inflation caused by recent Middle East supply shocks could prompt further interest rate hikes.
Disappointing data from China further weighed on market sentiment, as the country's economy grew at its slowest pace in three and a half years. The worst-performing stocks included Summerset Group (-2.6%), Auckland International Airport (-1.4%), Scales Corporation (-1.2%), A2 Milk (-1.1%), and Hallenstein Glasson (-1.1%).
Sector Performance:
Leading Sectors (Relatively Resilient, with a Few Gains)
1. Utilities (Electricity Sub-sector)
Significant divergence within the sector: Contact Energy bucked the trend, rising 1.2%; Meridian and Genesis weakened slightly. 1. Abundant reservoir water volume supports hydropower profitability expectations, while the sector's defensive attributes attract some funds.
2. Healthcare (Some Stocks) The sector is polarized, with senior living real estate stocks relatively resilient, offsetting some pressure on medical equipment stocks.
Leading Declining Sectors (Mainly Dragging Down the Overall Market)
1. Telecommunications Services [Weakest Sector of the Day] Chorus and Spark continued to be under pressure, with rising interest rates suppressing the valuation of high-dividend telecom assets.
2. Consumer Staples A2 Milk (-1.1%) and Scales Corporation weakened, with concerns about the outlook for Chinese demand weighing on export-oriented consumer stocks.
3. Financial Sector Banks and real estate trusts weakened overall, with the market continuing to price in expectations of higher interest rates lasting longer.
4. Information Technology / Technology Infrastructure Infratil was under pressure, following the weakening sentiment in the global data center and technology sectors.
Technical Analysis: The New Zealand Stock Exchange 50 Index closed at 13786.67 points, up 120.49 points or 0.9% for the day, setting a new record closing high. After the central bank raised interest rates on Wednesday, the index corrected, rebounded strongly on Thursday, and was closed all day on Friday due to the Matariki public holiday. There were only 4 trading days this week, with a cumulative weekly gain of 1.2%. Intraday range: The lowest point in the morning was around 13662, and the index rose to close at the high of the day, forming a bullish candlestick with no upper shadow. The bulls completely controlled the market during the day, repairing the gap caused by Wednesday's interest rate hike. Medium and long-term trend: It continues to run along the upward channel, constantly setting new historical highs, with no obvious top structure, which is a strong bullish trend. Technical indicator RSI (14): 61.8, which is in the bullish range. It has not entered the severely overbought range above 70 and still has room to rise, but it is close to the overbought threshold, and the risk of chasing the high is increasing. MACD: The red bars continue above the zero line, and the fast and slow lines maintain a golden cross, indicating ample bullish momentum; however, the amplitude of the red bars has narrowed slightly, suggesting a weakening of the upward momentum. Regarding volume: Thursday saw increased trading volume, with funds flowing back into financial, industrial, and healthcare sectors, confirming the validity of the rebound.
Trading Strategy:
Operation Approach:
Follow the trend and go long (prioritize this approach, aligning with the main trend)
1. Entry Range: Buy in batches on pullbacks to 13680-13720; do not chase long positions above 13780.
2. Stop Loss: Exit if the price breaks below 13650 (intraday support breached, invalidating the rebound logic). 3. Targets:
◦ First Take Profit: 13840–13850 (Reduce position by 50%)
◦ Second Take Profit: 13910–13920 (Exit all positions)
4. Holding Period: Hold until the market opens next Monday. No trading on Friday to avoid holiday news risks.
Short-term Short Selling (Only attempt shorting with a small position after a failed breakout)
1. Entry Conditions: A rise to 13840–13850 followed by a pullback, RSI reaching 70 and showing a long upper shadow before attempting a short position with a small position.
2. Stop Loss: Exit at 13880.
3. Targets: 13750, 13680.
4. Position Size Limits: Short positions must not exceed half the size of long positions. Strict risk control is required for counter-trend trades.
Risk Warnings:
1. Fed Policy Divergence: The meeting minutes revealed a divergence of opinions among officials regarding the path of interest rate hikes. If US inflation rebounds and the Fed adopts a hawkish stance, global risk assets will be under pressure, and the NZX50 will weaken following the global market.
2. Rising International Oil Prices: This pushes up global inflation expectations, strengthens tightening expectations in various countries, and suppresses the upper limit of stock market valuations.
3. Geopolitical Conflicts: The situation in the Middle East is disrupting commodity and market risk aversion, triggering capital outflows from equity markets.
Disclaimer: The information contained herein (1) is proprietary to BCR and/or its content providers; (2) may not be copied or distributed; (3) is not warranted to be accurate, complete or timely; and, (4) does not constitute advice or a recommendation by BCR or its content providers in respect of the investment in financial instruments. Neither BCR or its content providers are responsible for any damages or losses arising from any use of this information. Past performance is no guarantee of future results.
More Coverage





Risk Disclosure:Derivatives are traded over-the-counter on margin, which means they carry a high level of risk and there is a possibility you could lose all of your investment. These products are not suitable for all investors. Please ensure you fully understand the risks and carefully consider your financial situation and trading experience before trading. Seek independent financial advice if necessary before opening an account with BCR.
Jurisdiction Notice:Our services are not intended for residents of the United States & Canada, and we do not intend to distribute or use the provided information in any country or jurisdiction where it would be contrary to local law or regulation. It is important that you read and consider the relevant legal documents associated with your account, including the Terms and Conditions issued by BCR before you start trading. BCR Co Pty Ltd is regulated by the British Virgin Islands Financial Services Commission, Certificate No. SIBA/L/19/1122. The Registration Number in the BVI is 1975046. The Registered Address of the Company is Trident Chambers, Wickham’s Cay 1, Road Town, Tortola, British Virgin Islands.
BCR Co Pty Ltd (Company No. 1975046) is a company incorporated under the laws of the British Virgin Islands, with its registered office at Trident Chambers, Wickham’s Cay 1, Road Town, Tortola, British Virgin Islands, and is licensed and regulated by the British Virgin Islands Financial Services Commission under License No. SIBA/L/19/1122.
Open Bridge Limited (Company No. 16701394) is a company incorporated under the Companies Act 2006 and registered in England and Wales, with its registered address at Kemp House, 160 City Road, London, England, EC1V 2NX. Open Bridge Limited acts solely as a payment processor for BCR Co Pty Ltd and does not provide any financial, trading, or investment services on its behalf. Open Bridge Limited's role is limited to payment processing.


 English
 简体中文
简体中文
 繁體中文
繁體中文
 Bahasa
Melayu
Bahasa
Melayu
 Tiếng
Việt
Tiếng
Việt
 ไทย
ไทย
 日本語
日本語
 한국어
한국어
 ភាសាខ្មែរ
 español