


0
Currency & Commodity Analysis:
US Dollar Index
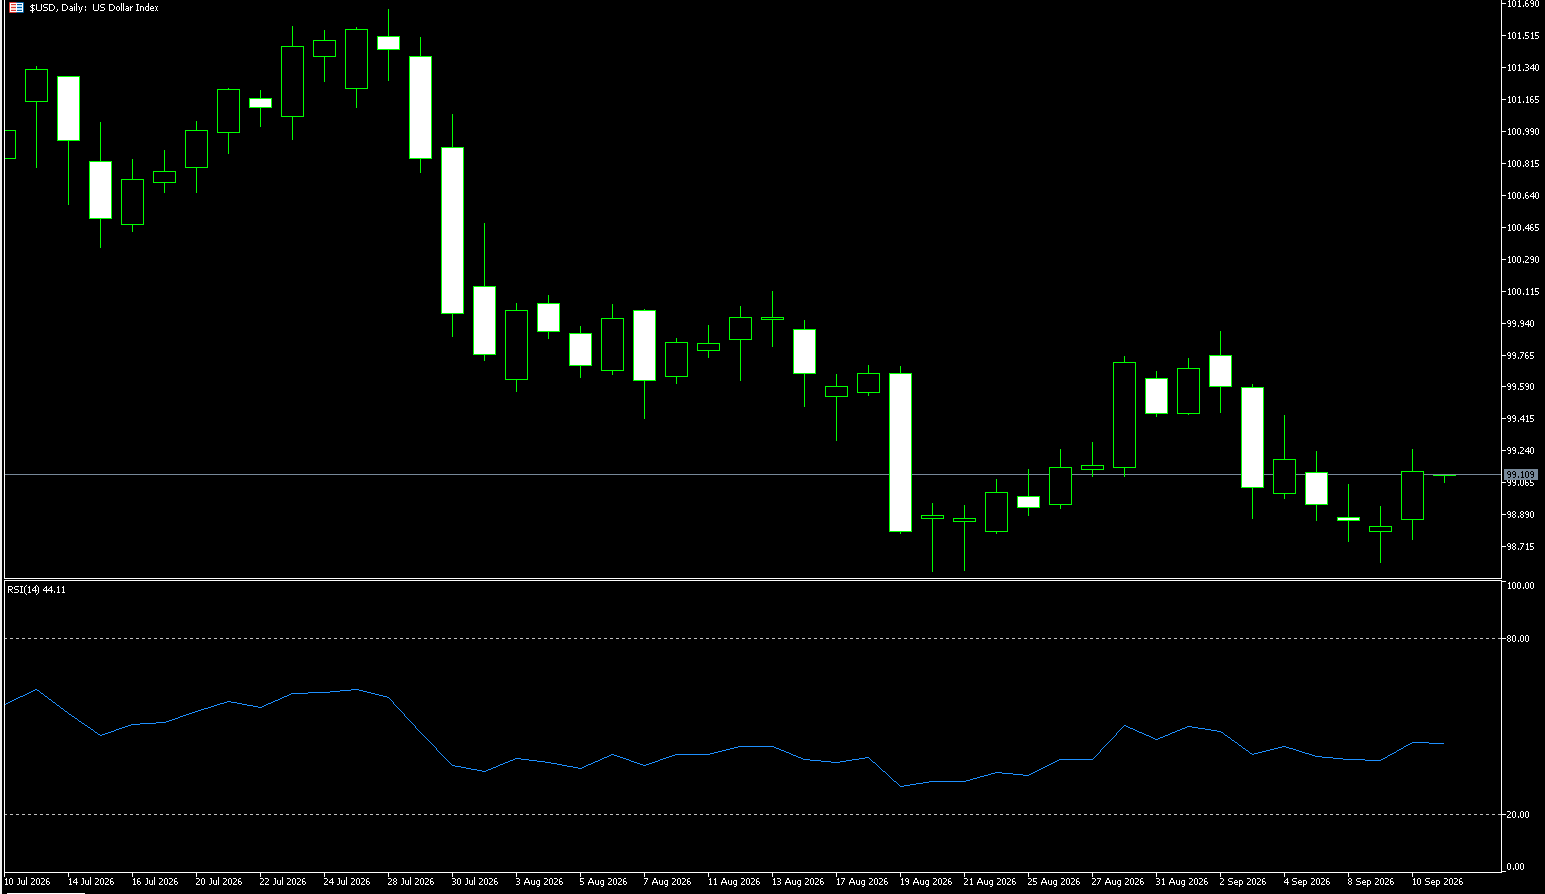
The US dollar remained strong last week; the Dollar Index consolidated within a narrow range near 100.30, hovering close to a six-week high. The market's repricing of the Federal Reserve's monetary policy path is the core driver behind the US dollar's recent strengthening. Last week, the Fed raised the federal funds rate by 25 basis points to a range of 3.75%–4.00% and signaled the possibility of further tightening before the year's end, thereby bolstering the dollar through an interest rate differential advantage. Among major currencies, the dollar's gain against the Japanese yen was particularly notable—rising approximately 2.28%—indicating that the dollar's strength was not limited to a single currency pair but was broadly driven by shifting expectations regarding US interest rates. Meanwhile, although the Bank of Japan raised its policy rate to 1.25% this week, the yen failed to gain sustained support; the USD/JPY exchange rate briefly climbed to just below 158, demonstrating that expectations regarding the US-Japan interest rate spread continue to exert a significant influence on the exchange rate.
Shifts in the Fed's policy trajectory are key to the dollar regaining upward momentum. Data from the CME FedWatch tool indicates that market expectations for at least one more rate hike this year have risen to approximately 88%, up significantly from 66.3% a week earlier. Concurrently, the Fed's "dot plot" reveals that 16 out of 18 officials anticipate at least one additional hike before the year concludes. This shift in policy expectations—moving from a looser stance to a more hawkish one—has provided fresh support for US Treasury yields and the dollar. For the market, this implies that even if the Fed has concluded the current cycle of rate hikes, policymakers might still opt for further increases to curb inflation rather than pivoting quickly to rate cuts. The resulting changes in interest rate expectations have directly fueled the dollar's renewed strength.
The pivotal event last week was the Fed's September policy meeting, which saw a 25-basis-point rate hike and the retention of expectations for another hike before year-end in the dot plot. Following the meeting, the dollar surged to test the 100.37 level before undergoing a period of minor consolidation, ultimately closing the week with a bullish candle. The core narrative driving the dollar has gradually shifted from "whether rates will be cut" to "whether further hikes will occur this year and how long high interest rates will be maintained." In this context, US inflation, employment data, PMI figures, and Treasury yields will collectively determine whether the US Dollar Index can transform the 100 mark from a resistance level into a new support level for the trend. The weekly chart closed bullish with rising lows, confirming a short-term rebound trend; however, medium-term resistance remains overhead, and the market has not yet shifted into a major one-sided bullish trend, characterizing the current state as a range-bound market with a bullish bias. Last week's market dynamics were driven by the confirmed rate hike and a hawkish "dot plot" that pushed up US Treasury yields, fueling a rally in the US Dollar; however, market disagreement regarding whether another rate hike would actually occur this year led to profit-taking after the initial surge, preventing a sustained, one-sided rally.
The US Dollar Index (DXY) is currently trading just above the 100.00 level on the daily chart, having reclaimed the 100-day Simple Moving Average (SMA) at 99.86; the short-term trend is shifting from consolidation to a bullish bias. The 14-day RSI stands at approximately 61.23—indicating relative strength without yet entering clearly overbought territory—suggesting that bulls retain the short-term initiative. If the index can firmly establish itself above the psychological 100.00 mark, it may test the previous highs of 100.37 (last week's high) and the 100.46 area (July 31 high); a breakout above these levels would target the 101.00 round number. Conversely, failure to achieve a decisive breakout could trigger profit-taking near the 100.00 level. On the downside, the 100-day SMA at 99.86 is the initial level to watch, as it currently serves as key short-term trend support. Should the index pull back but hold above the 200-day SMA at 99.16, the overall bullish structure remains intact; losing this level would signal waning upward momentum and a potential return to range-bound trading.
Consider shorting the US Dollar Index at 100.32 today; stop-loss at 100.42; target at 100.00; 99.90
WTI Spot Crude Oil
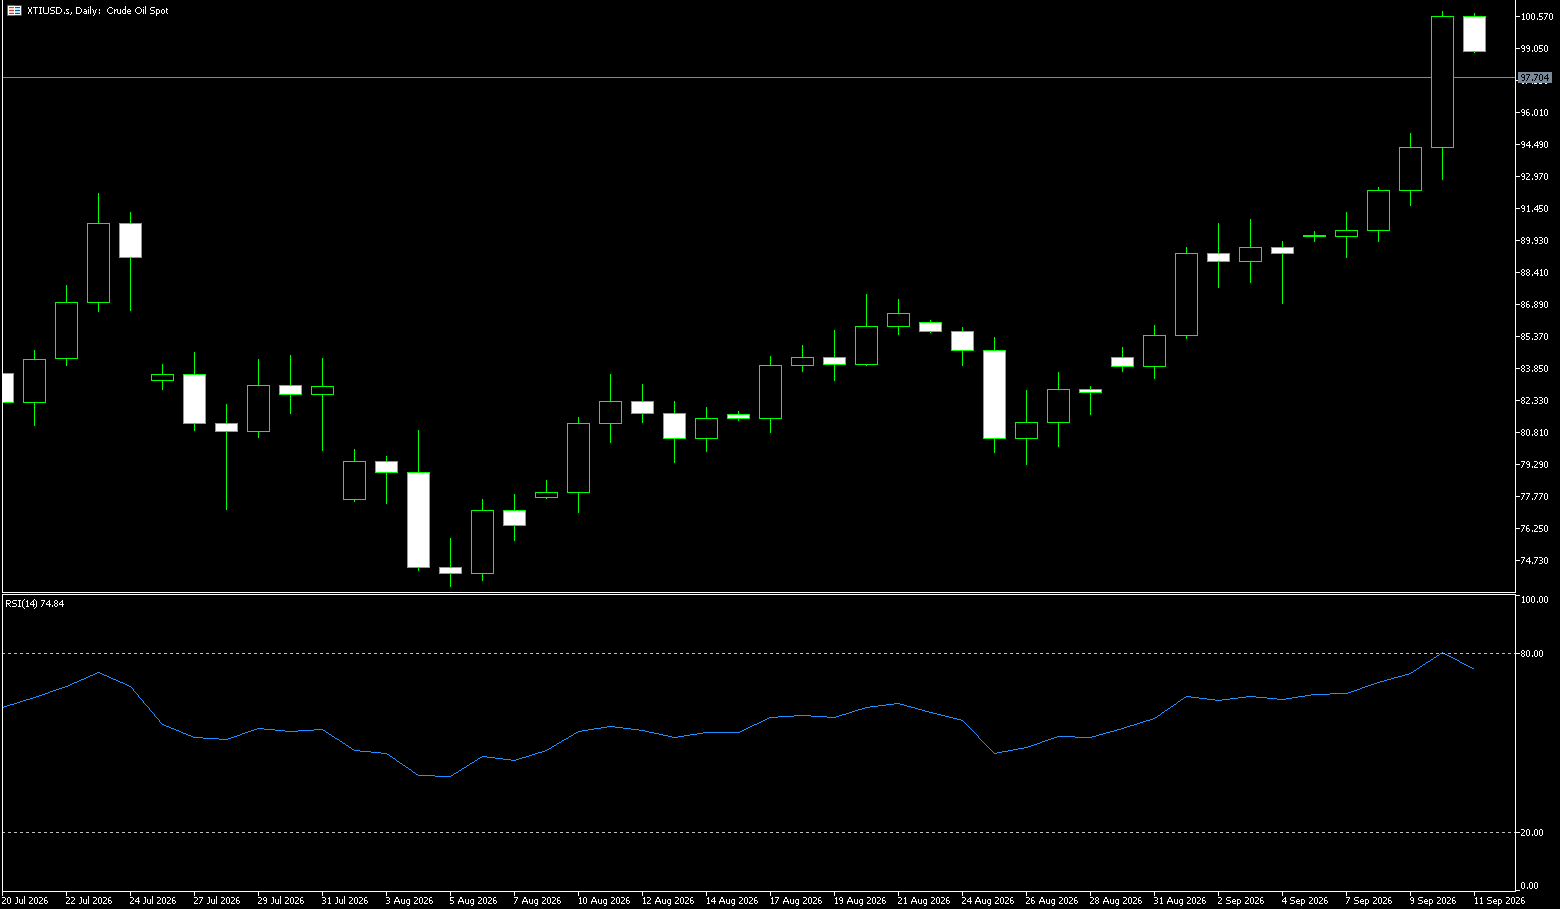
Regarding the WTI crude oil benchmark, international oil prices continued to retreat late last week; WTI crude fell, erasing almost all the gains from Thursday's rebound. Currently trading slightly above $95 per barrel, the market anticipates a slowdown in the overall upward momentum of oil prices over the next two months. The US-Iran conflict has entered a critical phase of maneuvering, where signals of diplomatic easing are counterbalanced by geopolitical risks in the Middle East. While the sudden seizure of a ship in the Strait of Hormuz and continued Houthi attacks on Saudi energy facilities drove prices up, measures to ensure Saudi crude export continuity—combined with the opening of the UN General Assembly diplomatic window—pushed prices back down from their highs, marginally easing short-term tensions in the Middle East crude supply chain. Market focus tends to shift between US and international developments when prices rise, and toward potential Iranian retaliation when prices fall.
The most significant positive development is the diplomatic thaw: the US has permitted an Iranian delegation to travel to New York for the UN General Assembly, where the Iranian president is scheduled to speak on September 23, effectively opening a window for formal US-Iran dialogue. Trump indicated that Iran is interested in a truce but has not yet accepted US terms; he confirmed direct contact with Iranian officials, though Iran has not yet issued an official response. During the UN General Assembly next week, Trump is set to meet with leaders from the six GCC nations, focusing on core issues such as Gulf energy security, the restoration of shipping in the Strait, threats from Iran-linked armed groups, oil price volatility, and post-conflict regional security arrangements. The US also announced sanctions against an Iranian digital currency exchange, accusing it of funneling approximately $1 billion to the Islamic Revolutionary Guard Corps (IRGC) and providing covert settlement channels for crude oil trade to help Iran evade shipping and financial sanctions. This represents a significant blow to the IRGC's cash flow. By precisely targeting Iran's channels for evading sanctions, these measures further restrict its crude oil exports and capital circulation, intensify economic pressure on the country, and increase US leverage in future negotiations.
Last week, WTI crude experienced a pattern of surging due to a geopolitical risk premium, followed by a pullback and fluctuation at high levels as news-driven tensions eased and the Federal Reserve's policy decision exerted downward pressure. At the start of the week, heightened tensions in the Middle East and shipping risks in the Strait of Hormuz drove up oil prices; WTI briefly challenged the strong resistance level of $102.10, but bulls failed to break through, establishing the week's high. Towards the weekend, the Federal Reserve's interest rate decision strengthened the US dollar. Combined with the resumption of shipping through the Strait of Hormuz and the discovery of alternative transit routes for Saudi crude exports, the geopolitical risk premium contracted rapidly. Additionally, the decline in EIA crude oil inventories was far less than expected; these bearish factors triggered profit-taking by bulls, causing prices to pull back quickly to the $95.30 area and enter a period of consolidation at high levels. Last week was characterized by high-level volatility and exhausted bullish momentum. Geopolitical news was the dominant variable, while technical analysis served merely to gauge price positioning following the news; the $100 mark remains a critical hurdle for the bulls. Repeated resistance at this level suggests limited short-term upside, shifting the market from a one-sided rally to a high-level range-bound struggle.
From a daily chart perspective, WTI crude has weakened over consecutive sessions, pulling back to just above $95.30 per barrel, yet it remains in a high-level consolidation phase following the earlier rapid rally. Although the price has cooled significantly, the daily trend cannot be viewed as a complete reversal unless it breaks below the key support zone established during the previous uptrend. Short-term market momentum has notably waned, and investors should watch whether the price can firmly re-establish itself above the key psychological round-number level. To the upside, the initial focus is the psychological resistance near $100; this level is significant both as a round number and as a crucial zone that must be breached for oil prices to regain strength. If WTI climbs back above $100 and stabilizes, the market may re-test the previous high of $102.10; conversely, failure to reclaim the $100 mark could see selling pressure at high levels limit the strength of any rebound. To the downside, the initial focus is support near $94.29 (the 14-day moving average), a critical defensive level for current prices; a breach of this support could see oil prices seeking new footing in the $90 region.
Consider going long on crude oil at 95.00 today; stop-loss: 94.80; targets: 96.50, 97.00.
Spot Gold
Gold rose to just below $4,400 per ounce last week, extending its gains. This upward movement was supported by falling oil prices, which eased inflation concerns and helped push down bond yields. Oil prices fell for a third consecutive session as Saudi Arabia worked to restore flow through its East-West Pipeline, and with President Trump scheduled to meet Gulf leaders next week. U.S. Treasury yields also retreated from multi-year highs; the 10-year yield fell to approximately 4.93% after briefly exceeding 5% earlier in the week. Meanwhile, investors continued to assess the outlook for Federal Reserve monetary policy following the central bank's first rate hike in three years. The Fed signaled that further tightening might be needed to curb inflationary pressures, and the market currently estimates a roughly 53% probability of a rate hike in October.
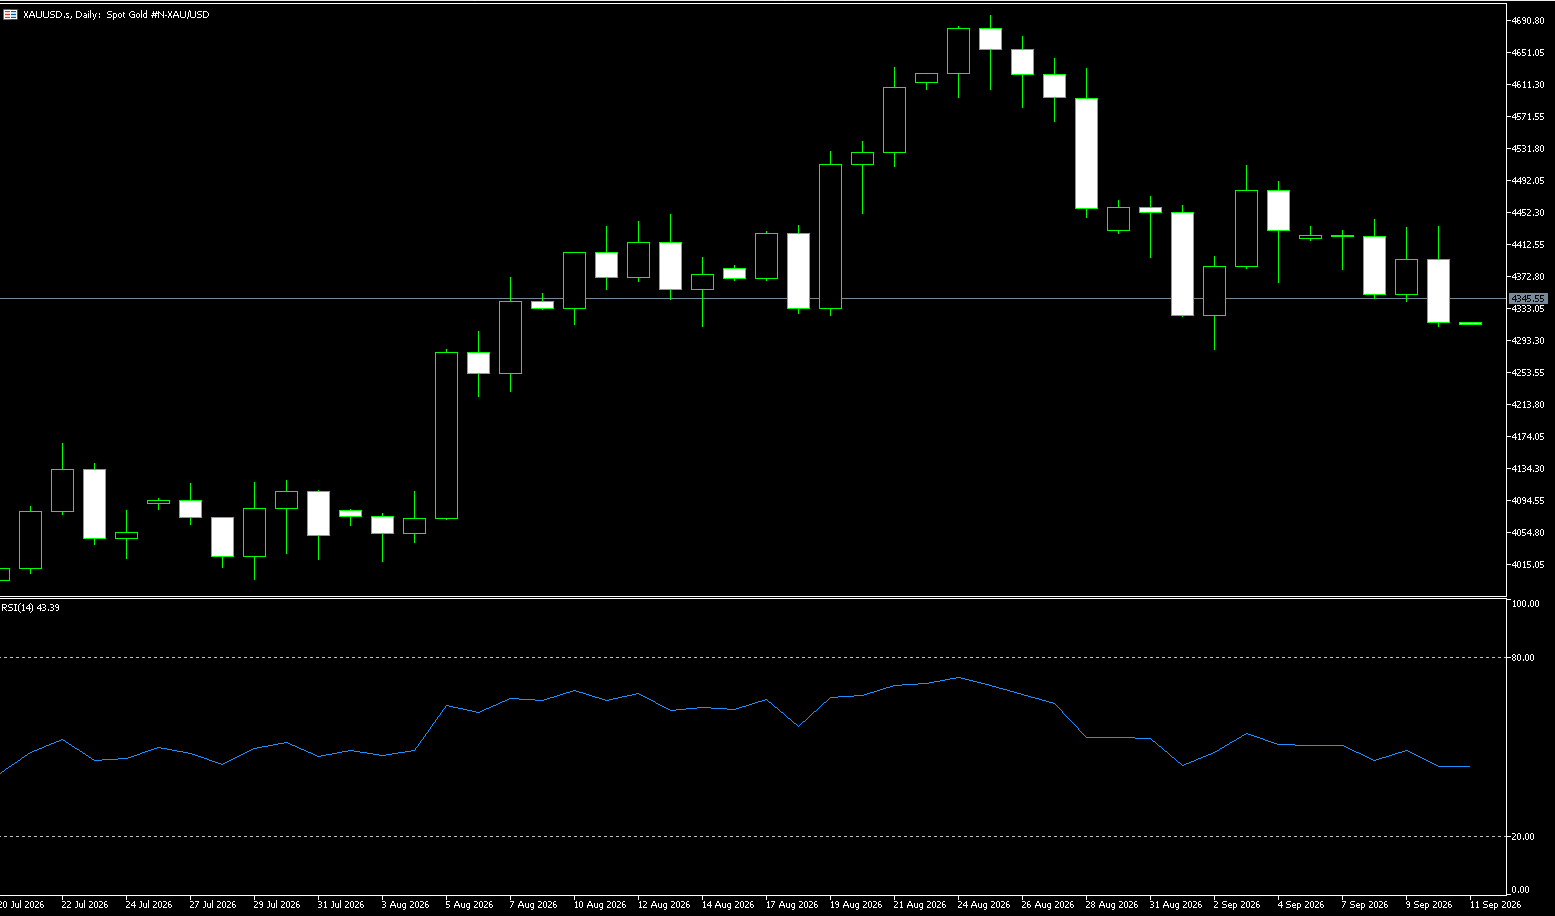
Spot gold saw buying interest enter the market late last week; however, during weekend trading, the price failed to break through the psychological $4,000 mark, resulting in mixed market signals. The pullback in international crude oil prices drove U.S. Treasury yields down from multi-year highs, easing short-term fears of runaway inflation and dampening dollar bullishness, which provided support for non-interest-bearing assets like gold. Expectations of a hawkish Fed policy stance continued to favor the dollar, suppressing investor appetite for aggressive long positions in gold. Compounded by ongoing market disruptions from Middle East geopolitical conflicts, gold prices are caught in a dilemma; upcoming U.S. industrial production data, speeches by Fed officials, and developments in the Middle East situation will determine the short-term trajectory of gold prices. At last week's Federal Reserve meeting, a 25-basis-point rate hike was implemented, and the "dot plot" kept the possibility of another hike this year on the table—a move characterized as a hawkish hike. Gold prices exhibited a classic "sell-the-fact" pattern: an initial sharp drop followed by a rapid V-shaped reversal. Following the meeting, the price dipped quickly toward the $4,234 level in the early hours but was met with heavy buying that rapidly recouped losses, resulting in a weekly candle with a long lower shadow—indicating strong underlying support. On the chart, the lows are rising, confirming a solid support base; weekly moving averages have turned upward, meaning the long-term bullish structure remains intact despite the rate hike. The weekly MACD green bars are shrinking, signaling exhausted bearish momentum, while the RSI has rebounded from lows into neutral territory; it has not yet reached overbought levels, leaving room for further upside. On the daily chart, the session following the meeting produced a bullish engulfing candle with a long lower shadow, pushing the price back above the 5-day and 10-day moving averages and transforming these short-term averages from resistance into support. MACD green bars are rapidly contracting, hinting at a potential "golden cross," and the RSI has rebounded from the oversold zone, indicating a quick recovery in bullish momentum.
Gold prices faced resistance at the 20-day simple moving average (SMA) of $4,422; while the price remains above key Fibonacci support, the short-term bias leans bearish. The metal is hovering just above the 100-day SMA ($4,321) and the 50% Fibonacci retracement level ($4,320)—a support zone that appears fragile following the recent decline. Meanwhile, the Relative Strength Index (RSI) stands at 52.02 (near neutral), while the MACD reads -19.60 (remaining in negative territory), suggesting that downward pressure continues to dominate. This implies that initial resistance for gold prices may lie at the 38.2% Fibonacci retracement level of $4,408 and the psychological mark of $4,400, followed by the 20-day simple moving average (SMA) at $4,422; stronger resistance is found at the 23.6% retracement level of $4,516 and the swing high of $4,692. On the downside, immediate support is located at the 50.0% retracement level of $4,320 and the 100-day SMA at $4,321, with deeper support further down at $4,222 (the September 2 low).
Consider going long on gold at $4,373 today; stop-loss at $4,368; targets: $4,420, $4,430.
AUD/USD
The Australian dollar rose above $0.71, attempting to rebound from a recent four-week low, as hawkish remarks from a top Reserve Bank of Australia (RBA) official bolstered expectations for further policy tightening. Swap markets now anticipate at least two rate hikes by the February meeting, with an approximately 87% probability of an initial hike by September 29. This marks a significant shift from early September, when traders expected only one more hike, likely before year-end. The Aussie also benefited from a softer US dollar, falling Treasury yields, and retreating oil prices, while a rebound in global stock markets improved risk sentiment.
The AUD/USD pair traded near the 0.7100 level last week. This modest rebound was driven by a market repricing of expectations for further RBA rate hikes. RBA Governor Michele Bullock told the House of Representatives Standing Committee on Economics last week that the upside inflation risks flagged in the August Statement on Monetary Policy were materializing—driven by factors such as Middle East oil prices, the AI boom, and extreme weather—even as growth slowed and the unemployment rate held at 4.5%. Bullock’s acknowledgment that upside inflation risks were "materializing" rather than merely possible was viewed as hawkish, coming just over a week before the board meeting. She explicitly linked rising Middle East oil prices to direct and indirect inflationary pass-through, offering the market a clearer signal that further rate hikes remain a possibility. The Australian dollar likely drew some support from this hawkish tone.
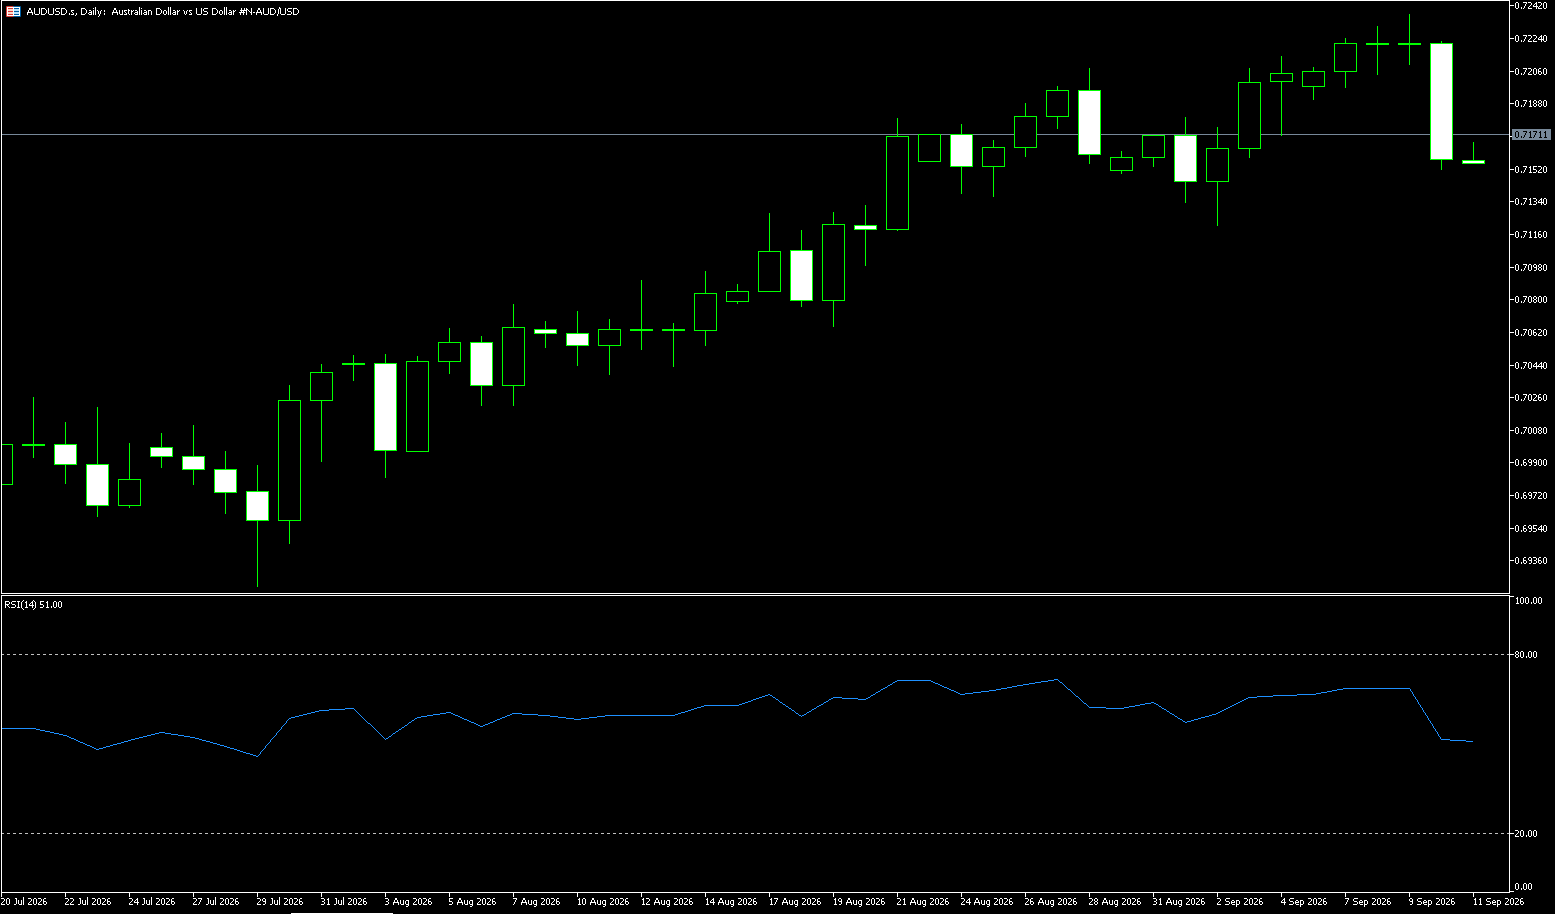
Regarding last week's AUD/USD price action: the pair exhibited weak, volatile movement characterized by an initial spike followed by a pullback and a downward shift in the trading range. After facing resistance near 0.7200 early in the week, the exchange rate fell steadily—weighed down by rising expectations of Federal Reserve rate hikes and climbing US Treasury yields—and touched a low near 0.7130. A slight oversold rebound occurred on Friday, but the momentum was weak; the price closed below the 50-day moving average, undermining the bullish structure on the daily chart. Daily RSI: It has pulled back to around 48—showing weakness but not yet deeply oversold. The exchange rate has settled below the 20-day moving average (0.7165), which has turned into a level of short-term resistance and exerts dynamic bearish pressure. Consequently, last week's technical conclusion was that the broader structure has shifted from range-bound to bearish, with the short-term outlook dominated by bears. Although there was an oversold rebound on Friday, it was merely a corrective move rather than a reversal signal; the rebound is best viewed as an opportunity to sell into strength, and the short-term bearish setup will only be invalidated if the price stabilizes above the 20-day moving average at 0.7165.
On the daily chart, AUD/USD is trading near 0.7125, maintaining a short-term bullish bias as the price remains above the 50-day (0.7084), 100-day (0.7078), and 200-day (0.7012) simple moving averages. The 14-day Relative Strength Index (RSI) stands at 48.52, having retreated toward the neutral zone, while the Average Directional Index (ADX)—near 22—indicates a trend with some directionality but limited strength; this suggests that any upward movement is likely to be gradual rather than a sharp surge. To the downside, initial support lies at the 50-day (0.7084) and 100-day (0.7078) simple moving averages, followed by the 200-day moving average at 0.7012 and the psychological level of 0.7000. To the upside, AUD/USD faces immediate resistance at 0.7165 (20-day simple moving average), with further hurdles at the 0.7200 round number; a breakout above this level would pave the way for a broader bullish extension toward 0.7237 (the September 9 high).
Consider going long on the Australian Dollar (AUD) at 0.7112 today; stop-loss: 0.7100; targets: 0.7150, 0.7160.
GBP/USD
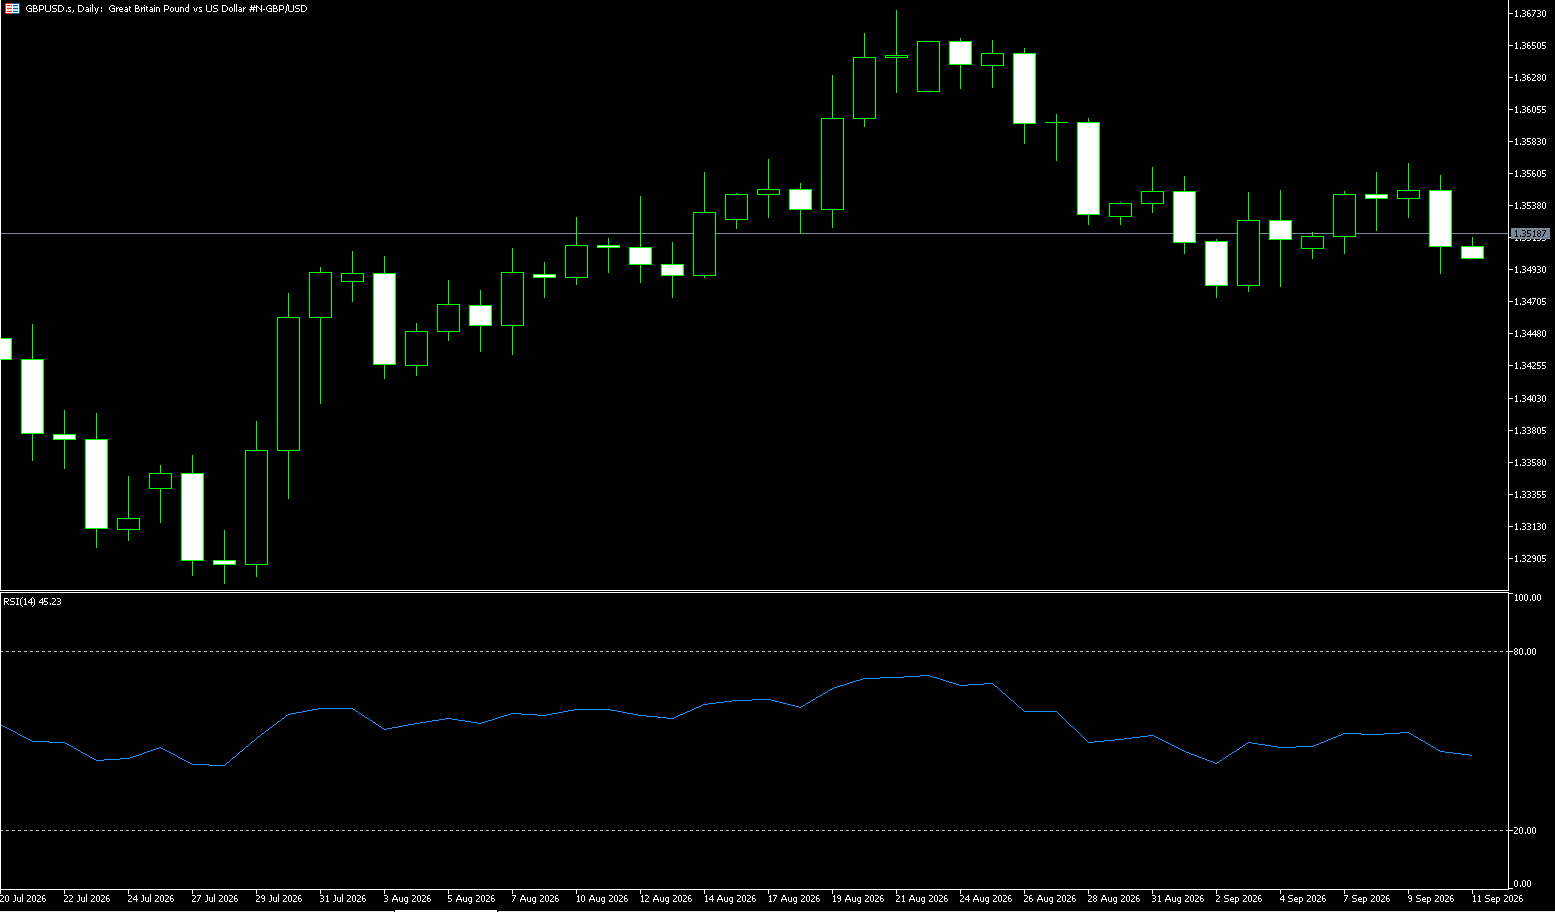
Last week, the market continued to digest the interest rate decisions made by the Bank of England (BoE) and the Federal Reserve. Although the BoE kept the bank rate unchanged at 3.75%, a 6-3 vote split indicated that some policymakers were already leaning towards further rate hikes; meanwhile, the Federal Reserve raised rates by 25 basis points to a range of 3.75%–4.00%, allowing the US Dollar to regain its interest rate advantage. Following these shifts in policy paths by the two central banks, GBP/USD remains in a pattern of volatility with a bearish bias in the short term. On the UK front, August retail sales data provided some support for the pound. UK inflation remains a key variable influencing the pound's trajectory. Rising energy prices could keep UK inflation elevated in the coming months; the BoE has indicated a need to closely monitor whether energy costs trigger broader "second-round" inflationary effects. If this pressure persists, market expectations for a November rate hike could intensify, thereby supporting the pound.
In contrast, the Federal Reserve's policy stance is exerting more direct pressure on the GBP/USD pair. The Fed raised rates by 25 basis points to 3.75%–4.00% last week—the first hike since 2023. Fed Chair Warsh emphasized that US inflation remains high and recent data are insufficient to prove a clear improvement in underlying inflation trends. Consequently, the market has raised its expectations for further Fed rate hikes. If US inflation and employment data remain resilient, expectations for further policy tightening could strengthen, widening the US Dollar's interest rate advantage over the pound. Meanwhile, the recent strength of the US Dollar has also capped the rebound in GBP/USD. Although the US Dollar Index previously climbed above the 100 mark and US Treasury yields and oil prices have recently retreated, the dollar remains supported by expectations of a hawkish Fed policy. Last week, the GBP/USD pair faced downward pressure from a combination of the Federal Reserve's hawkish stance and the Bank of England's relatively dovish decision. The pair closed the week with a large bearish candle, shifting the trend from consolidation to bearish dominance. The exchange rate remained capped below 1.3525; on the daily chart, it faced persistent resistance from the 50-day moving average, with multiple failed rebound attempts and a gradual downward drift in price levels. The previous support level at 1.3460 was breached, turning it into a resistance level. As the Fed signaled a hawkish stance and the US dollar strengthened, the pair declined further; the RSI dropped into the oversold zone (below 30) as bearish momentum surged, testing lows near 1.3340. Before the weekend, the pair underwent a period of narrow-range consolidation at low levels; the MACD green histogram narrowed and the RSI recovered slightly, indicating a waning of bearish momentum, though no trend reversal signal emerged—suggesting merely a consolidation phase following oversold conditions.
On the daily chart, GBP/USD is currently trading near 1.3360, remaining within an overall short-term downtrend structure. The price sits below the Bollinger Bands' middle line (1.3516) and faces resistance from the 100-day moving average (1.3437), signaling a weak medium-term trend. The 14-day RSI stands at approximately 31.31, nearing the oversold zone; this indicates an accumulation of bearish momentum, though there is currently no clear signal of a trend reversal. Key upside levels to watch include the 100-day moving average near 1.3437—a level that has shifted from technical support to short-term resistance—and the 100-day moving average near 1.3438, which serves as the most critical medium-term resistance. If the price reclaims the 1.3500 psychological level and the Bollinger Bands' middle line at 1.3516, the potential for a short-term rebound could expand. On the downside, key levels to monitor include the 1.3300 psychological mark, followed by the 1.3250 and 1.3200 areas. If GBP/USD continues to trade below 1.3365 and breaks through 1.3300, it suggests that the recent bearish structure could extend further; conversely, if the exchange rate holds above 1.3300 and breaks back above 1.3437, the short-term technical outlook will shift from bearish to a range-bound recovery phase.
Consider going long on GBP at 1.3382 today; Stop-loss: 1.3370; Targets: 1.3440, 1.3450.
USD/JPY
The Bank of Japan raised its policy interest rate by 25 basis points to 1.25%, a move that had been widely telegraphed. However, the decision was not unanimous; board members Toichiro Asada and Ayano Sato opposed the hike, signaling some resistance to a faster pace of policy tightening. Despite the dissent, Governor Kazuo Ueda stated at the post-meeting press conference that the Bank of Japan remains prepared to raise rates further and adjust the level of monetary easing based on economic developments. Meanwhile, official data showed Japan's core inflation rate fell to 1.7% in August from 1.8% in July—the first decline in four months.
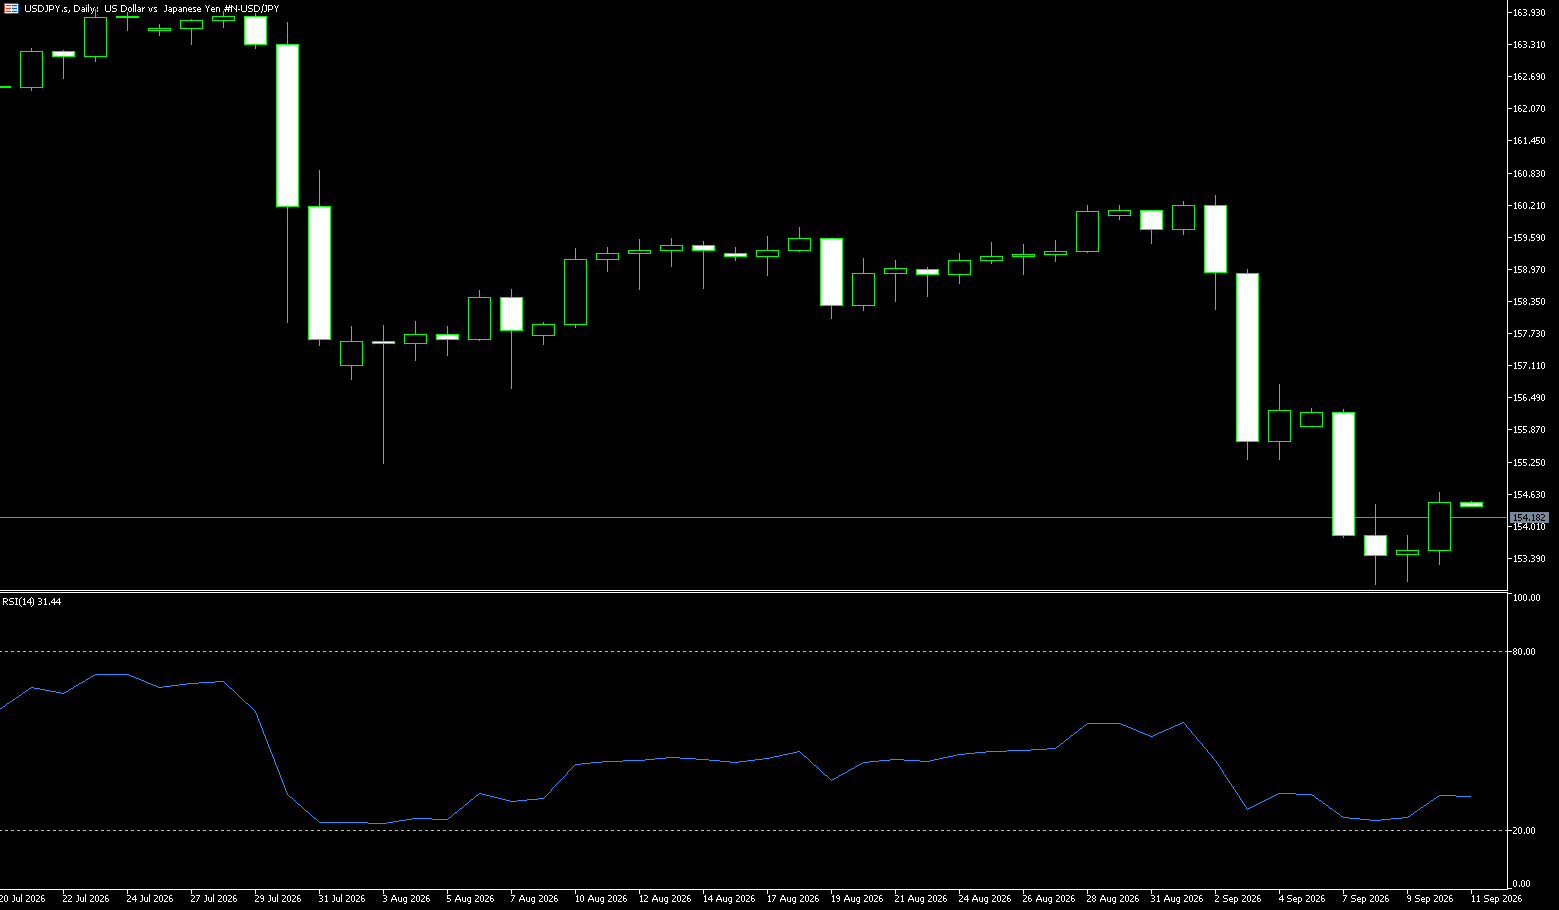
On Friday (September 18), the Bank of Japan voted 7-2 to raise the policy rate by 25 basis points to approximately 1.25%—the highest level since 1993—with the new guidance taking effect on September 24. USD/JPY initially surged nearly 70 points to 156.84 before continuing to climb, hitting a fresh two-week high of 157.14. The pair rose nearly 100 points (approx. 0.76%) following the decision, indicating the market was unimpressed by the BOJ's hawkishness; this aligns with the pattern where the hike was already fully priced in, leaving little room for surprise regarding the 25-basis-point increase itself. The central bank noted genuine two-way risks to the outlook, highlighting the need to closely monitor the impact of the Middle East situation, the expansion of AI-related demand, and exchange rate movements on economic activity and prices. It is worth noting that, given the shift toward wage and price hikes among businesses and rising inflation expectations, underlying CPI inflation may deviate upward from the 2% target.
Review of this week's technical trends: On Friday, the Bank of Japan (BOJ) announced a 25-basis-point rate hike to 1.25%. However, the decision passed with a 7-2 vote—with two members dissenting—sending an unexpectedly dovish signal; consequently, the USD/JPY pair spiked to around 157.60 in the short term. Weekly structure: The pair staged a recovery after testing lows and broke out to the upside. The previous low of 152.89 served as the support level for this phase; the price trended steadily upward from above 153, with the center of gravity shifting higher. The daily chart formed a continuous bullish rebound structure, erasing most of the yen's gains from early September. Key pivot point: Friday's rate hike represented a variation of the "buy the rumor, sell the fact" scenario. While the hike was already priced in, the two dissenting votes dampened expectations for sustained future hikes; the fact that USD/JPY rose rather than fell confirms that the market's core driver remains the interest rate differential between the US and Japan, and a single rate hike is insufficient to reverse carry trades.
Analysis of next week's technical trends—Overall outlook: Bullish bias with range-bound movement, though short-term overbought conditions suggest a period of consolidation first. Two scenarios: Bullish scenario—holding the 155.30 support level and continuing to test the 158.15 resistance level; Pullback scenario—bulls taking profits, with a retest of the 154.70–155.30 zone to confirm support before a directional move is determined. After breaking through the confluence level of 156.60—formed by the 100-period simple moving average and the 50.0% Fibonacci retracement level—USD/JPY maintains a bullish bias in the short term. On the upside, resistance is found at the 200-day moving average (158.42), followed by the 78.6% Fibonacci retracement level (158.74), the psychological level of 160.00, and the area around the cycle high of 160.35. On the downside, immediate support lies at the 50.0% Fibonacci retracement level (156.60) and the 20-day moving average (156.85); further retracement would target the 38.2% level (155.71), followed by the 155.00 round-number mark.
Consider going short on the USD at 157.00 today; Stop Loss: 157.20; Targets: 156.00, 156.10.
EUR/USD
For most of last week, the EUR/USD exchange rate fluctuated within a narrow range just below the 1.1500 level. After hitting a six-week low near 1.1500, the pair entered a period of consolidation as investors looked beyond the hawkish rate decisions from the ECB and the Federal Reserve. Last week, the ECB raised key policy rates by 25 basis points as expected, in an effort to curb rising inflationary pressures. While the ECB maintains that inflation risks are skewed to the upside, it has yet to see significant evidence of second-round inflation effects. Nevertheless, driven by rising energy prices, financial markets have raised their expectations for future ECB rate hikes. The US dollar outperformed the euro last week after the Federal Reserve broke a streak of five consecutive holds by raising interest rates by 25 basis points to the 3.75%–4.00% range.
The EUR/USD exchange rate remains under pressure due to the Fed's shift to a hawkish stance and growing market expectations for further near-term rate hikes; the prevailing downtrend shows no clear signs of reversal. EUR/USD is once again in the spotlight as traders watch to see whether the euro can recover some of yesterday's losses or if the pair will soon hit new lows. This market move was driven primarily by the US dollar rather than the euro—a common occurrence in the forex market, where the dollar is involved in approximately 75% of all trading volume. At its September policy meeting last week, the Federal Reserve raised interest rates by 25 basis points and signaled the possibility of further hikes in the coming months. The decision to raise rates was unanimous, reflecting a generally hawkish stance among officials; markets are pricing in the probability of another rate hike this year. This hawkish policy stance provided support for the dollar, thereby exerting downward pressure on major non-US currencies.
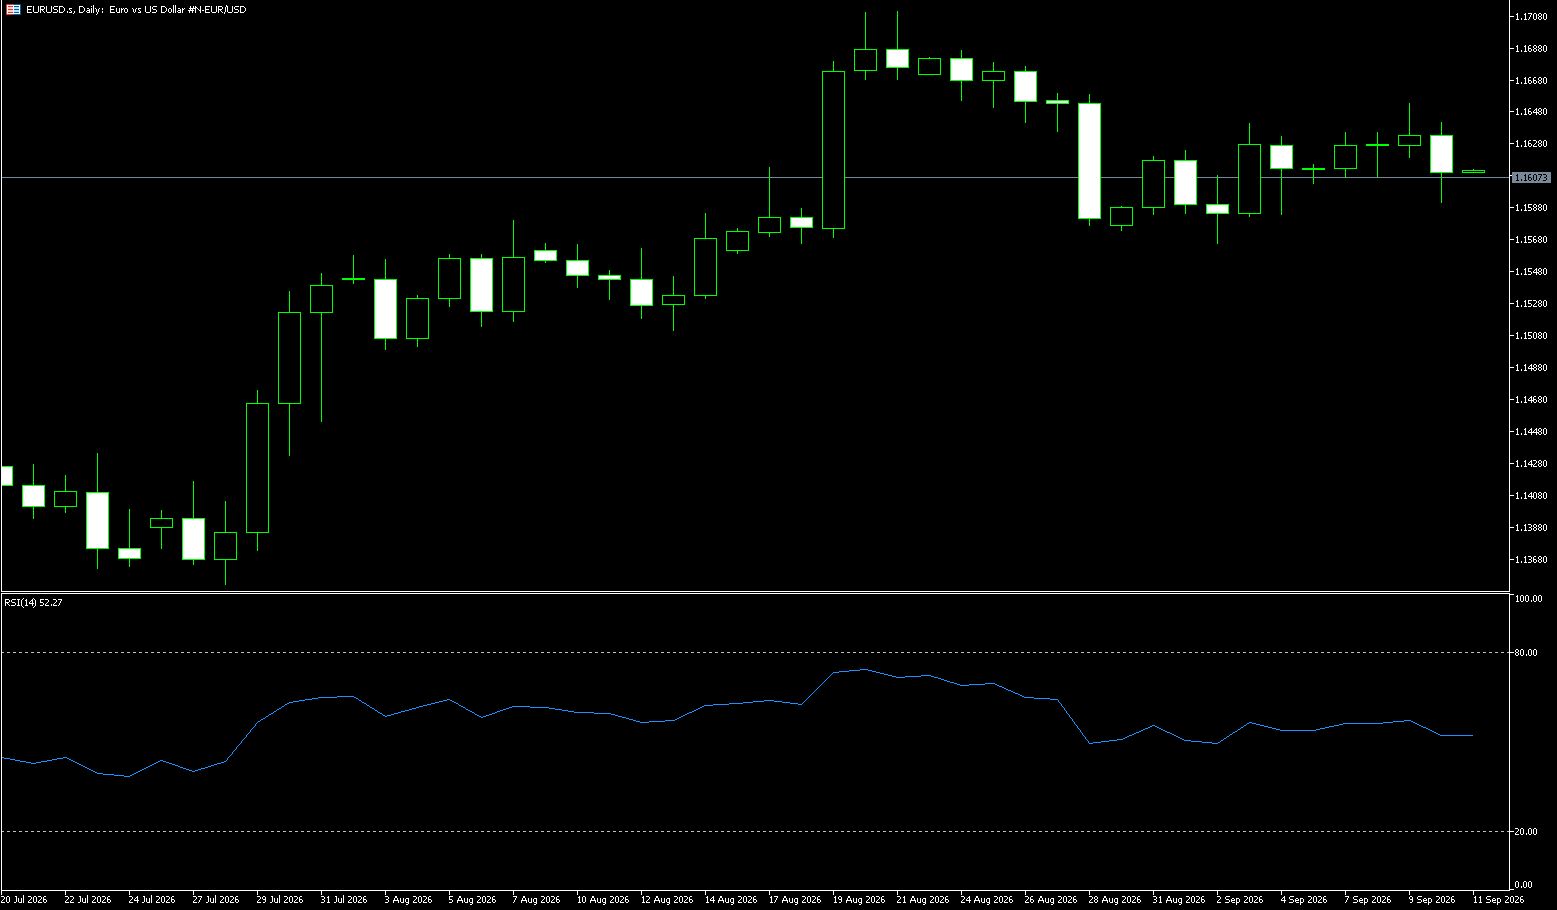
Following the Fed's September FOMC decision and the release of a hawkish "dot plot" last week, the dollar strengthened; the EUR/USD pair broke lower, shifting the daily chart into a bearish structure. Early in the week, the exchange rate fluctuated above 1.1550 but subsequently came under pressure, falling below the 55-day moving average and the key support level of 1.1490 (the lower edge of the Ichimoku Cloud). It dipped to a low near 1.1400 before staging a modest rebound from the lows on Friday to close around 1.1480. Weekly chart pattern: A bearish candle with a long lower shadow; the overall weekly price level shifted downward, indicating a continuation of the bearish trend following the breakdown. Friday's rebound was merely a correction from oversold conditions and did not alter the broader structural trend. The 21-day EMA is nearing a crossover below the 55-day EMA—a potential "death cross" signal—indicating accumulating bearish momentum. The price remains consistently below short-term moving averages, which are exerting significant downward pressure. RSI (14): Dropped into the weak zone below 40; after briefly entering oversold territory, it recovered slightly but shows no clear signal of a bullish reversal.
On the daily chart, EUR/USD is trading slightly below 1.1500, with the spot price remaining below the 50-day simple moving average (1.1536), maintaining a short-term bearish tone. The currency pair failed to reclaim this short-term simple moving average (SMA), indicating that the rebound remains limited for now. Meanwhile, the Relative Strength Index (RSI) stands at 34.34—slightly above the oversold zone—suggesting persistent downward pressure but also room for consolidation rather than an immediate collapse. On the upside, initial resistance lies at the 50-day SMA (1.1536); a break above this would expose the 1.1593 level (Bollinger Band midline). To alleviate the current bearish bias and drive a more significant rebound, a sustained break above the 1.1600 psychological level is required. On the downside, the six-week low near 1.1456 serves as key support, followed by the 1.1400 round-number level.
Consider going long on the EUR at 1.1468 today; Stop Loss: 1.1456; Targets: 1.1520, 1.1530.
Stock Analysis:
Australia ASX 200 Index
Market Overview:
The ASX 200 index closed at 8,731 on Friday, holding onto recent gains as strong performance in the technology, industrial services, and non-energy materials sectors was offset by weakness in healthcare, energy stocks, and non-durable consumer goods. Early gains faded after Reserve Bank of Australia (RBA) Governor Michele Bullock delivered hawkish remarks in Parliament, warning that inflation remains stubbornly high with emerging upside risks, leaving the possibility of further rate hikes on the table. Meanwhile, US stock index futures strengthened as oil prices and US Treasury yields softened. Heavyweight BHP rose 1.4%, while gold miners Evolution Mining (+4.4%) and Northern Star Resources (+2.4%) also posted gains.
Conversely, the "Big Four" banks fell between 0.2% and 1.9%, Xero dropped 4.1%, and BlueScope Steel declined 3.1%. The benchmark index fell 0.1% for the week—marking a third consecutive weekly decline—amid growing market caution ahead of the release of Australia's August labor data, following an unexpected rise in the unemployment rate and job losses in July.
Sector Performance:
Top-performing sectors: Materials (mining) and Energy. BHP, Rio Tinto, and gold miners showed strength; high prices for international copper, iron ore, and oil provided support for resource stocks.
Worst-performing sectors: Banking, Healthcare, and Information Technology. Hawkish comments from RBA officials led the market to reprice interest rate expectations, keeping heavyweight bank stocks under pressure, while tech stocks weakened in tandem with fluctuations in US Treasury yields.
Technical Analysis:
Review of last week's technical trends: The ASX 200 recorded its third consecutive weekly decline. Throughout the week, the index fluctuated within a narrow range while testing lows, characterized by an intense tug-of-war between bulls and bears. Overall, the market exhibited an oversold consolidation and recovery phase within a broader downtrend. Closing at 8,731 on Friday, the index posted a weekly loss of approximately 0.1%; while the magnitude of the decline narrowed significantly compared to previous weeks and downward momentum slowed, a bottoming-out reversal has not yet been confirmed. Moving Average Structure: The index has fallen below the 200-day moving average (approximately 8829), and medium-term moving averages are aligned in a bearish formation; the 50-day moving average continues to exert downward pressure, acting as a strong resistance level, indicating that the medium-term trend has shifted into a correction phase. Technical Indicators: The daily RSI briefly entered deep oversold territory (near 28.88) and showed a slight bullish divergence signal, triggering a short-term rebound; however, the rebound lacked strength, characterizing it as a corrective bounce amidst a downtrend rather than a signal of a trend reversal.
Technical Outlook for Next Week: Key events include Australia's August employment data, alongside factors such as US Treasury yields, international commodity prices, and geopolitical tensions in the Middle East. The overall outlook is for range-bound volatility with a bearish bias, likely fluctuating between 8600 and 8800. Sectoral divergence is evident: heavyweight banking stocks drag down the index during rallies, while the resources sector provides support during declines. Trading volume remains subdued, reflecting a strong "wait-and-see" sentiment as the market awaits Australian employment data and cues from US equity markets. Scenario 1: Bullish-leaning (30% probability). Conditions: Employment data falls short of expectations, US Treasury yields retreat, and commodities strengthen; the index holds firm at 8775, decisively breaks above 8800, and closes there. Target: Rebound to 8875; only by firmly establishing itself above 8875 is there a chance to reverse the short-term downward structure. Characterization: A corrective rebound within a downtrend, not a trend reversal. Scenario 2: Neutral oscillation (45% probability, baseline scenario). Conditions: Employment data meets expectations without significant surprises; the index oscillates within the 8675–8775 range. Price action: Repeatedly tests the 8700 support level; multiple attempts to rebound to 8775 meet resistance and pull back; RSI fluctuates around 40; range trading dominates.
Trading Strategy (Short-term perspective)
Short-term trading strategy (suitable for intraday or 1–3 day swing trades)
Short-term long strategy (playing the rebound only; light position)
1. Entry conditions: Pullback to the 8675–8700 support zone, appearance of a candlestick signal indicating a halt in the decline, plus simultaneous stabilization of the AUD and commodities.
2. Take-profit: First target 8775, second target 8800; reduce position or exit near 8800; do not chase highs.
3. Stop-loss: Exit if there is a decisive break below 8650 (based on closing price, not just an intraday dip below the level).
4. Position sizing: Light position, not exceeding 20% of total capital; this is a counter-trend trade betting on a rebound, carrying higher risk. Short-term Short-selling Strategy (Trend-following Approach)
1. Entry Conditions: Price rebounds to the 8775–8800 resistance zone, stalls (forming a bearish/stalling candlestick pattern), and US stock futures weaken during the night session;
2. Take-Profit: First target 8700, second target 8675; if the price breaks below these levels, look toward 8600;
3. Stop-Loss: Exit short positions if the closing price stabilizes above 8810;
4. Position Sizing: Avoid heavy short positions during range-bound trading; add to the position only after a downward breakout is confirmed.
Key Risk Warnings:
1. RBA Rate Hike Expectations: Stronger-than-expected Australian employment data could drive up market pricing for an RBA rate hike on September 29, weighing on financial stocks and the broader market;
2. US Treasury-Equity Correlation: Rising US 10-year Treasury yields put pressure on global risk assets, causing the ASX 200 to fall in sympathy;
3. Commodity Volatility: Sharp fluctuations in iron ore, copper, and oil prices directly impact heavyweight resource stocks like BHP and Rio, amplifying index volatility;
4. Geopolitical Risk: Middle East tensions disrupt crude oil prices and drive up global inflation expectations;
Dow Jones Industrial Average
Market Overview:
US stocks saw mixed results on Friday (September 18) as investors continued to digest the impact of the Federal Reserve's first rate hike in three years, while facing the dual pressures of US Treasury yields rising back above 5% and international oil prices remaining above $100 per barrel. The Dow Jones Industrial Average closed down 95.40 points (0.18%) at 51,682.64; the S&P 500 rose 0.17% to 7,650.50; and the Nasdaq Composite rose 0.39% to 26,522.55. Markets experienced significant volatility this week. On Wednesday, the Federal Reserve raised the federal funds rate by 25 basis points and signaled the possibility of at least one more hike this year, triggering a sharp decline in U.S. stocks that day. Markets staged a strong rebound on Thursday—with technology stocks regaining investor favor—demonstrating that some investors remain willing to bet on AI-driven earnings growth to offset the pressure of a "higher-for-longer" interest rate environment. However, renewed upward pressure on U.S. Treasury yields on Friday capped the overall upside momentum for equities. For the week, the Dow Jones Industrial Average fell 1.7%, marking its third consecutive weekly decline and its worst performance since March; the S&P 500 edged down approximately 0.1%, while the Nasdaq—heavily weighted toward technology stocks—bucked the trend to rise 0.7%. Market performance reflects a clear divergence in capital flows: on one hand, high interest rates and oil prices continue to weigh on traditional cyclical sectors; on the other, the AI theme continues to provide support for large-cap technology stocks.
Sector Performance:
Leading Sectors
Leading sectors: Healthcare and select heavyweight technology stocks; capital shifted toward defensive plays, with risk-averse funds moving slightly from cyclical and financial sectors into defensive areas.
Laggard sectors: Financials (Goldman Sachs, JPMorgan Chase), Industrials, and Energy. Expectations of Fed rate hikes drove up long-term Treasury yields, pressuring high-dividend financial stocks and acting as a primary drag on the market this week. IBM saw a significant pullback, serving as the largest drag among Dow components.
Technical Analysis:
U.S. stocks closed the week down 1.70%, trading between a high of 52,750.88 and a low of 51,186.67. The week's price action showed an initial choppy decline, an accelerated sell-off on Wednesday, a modest rebound on Thursday, and renewed pressure on Friday; the short-term upward channel has been broken, shifting the market into a pattern of weak, range-bound fluctuation. The lower boundary of the previous rectangular trading range (52,771) was decisively breached, invalidating the prior upward channel. The market is currently oscillating within the 51,180–52,000 range; a key support level lies at the neckline of 51,040, and a break below this would open the door for further downside. Following the Federal Reserve's rate hike, the market interpreted the move as hawkish, causing indices to plunge—dropping 1.21% in a single day to a weekly low of 51,186. Financial and energy sectors led the decline, with IBM and Goldman Sachs among the biggest losers, while technology and healthcare sectors showed relative resilience, resulting in sectoral divergence.
Technical outlook for next week (Sept 21–25): Until a decisive breakout above 52,100 or a drop below 51,040 occurs, the market remains in a range-bound phase, seeking direction amidst high uncertainty. A "wait-and-see" approach is advisable; one should wait for a breakout from the range before opening a position in the direction of the trend to avoid getting stopped out by whipsaw volatility. Three scenarios are projected for next week: Base Case (highest probability)—consolidation and recovery at low levels, with price action oscillating around the 51,400–51,500 support zone. Provided the 51,040 support holds, an oversold rebound is likely, targeting 51,800 initially, followed by a test of 52,100; however, this rebound would likely be weak, facing resistance and pulling back, with little chance of breaking 52,770 on the first attempt. Bearish Case—downward breakout; the price drops below 51,040 early in the week and consistently closes below it, unleashing renewed bearish momentum. The next target is 50,400, with ultimate medium-term support near the 200-day moving average at 50,060. Trigger conditions include rising US Treasury yields, higher-than-expected inflation data, and downward revisions to corporate earnings guidance. Bullish Case—reversal and rebound; the 51,400 support holds, and the price climbs above 52,100 on high volume, closing firmly above that level. Only then could it challenge 52,770 and repair the short-term trend. Without a strong fundamental catalyst, the probability of this scenario is low. Regarding technical indicators: if the RSI dips below 30, a stronger rebound could be triggered; a MACD "golden cross" would signal short-term bullishness, though a cross on low volume could easily be a "bull trap." Trading Strategy:
Short-term Long Strategy (Play the rebound only; do not bet on a sustained uptrend)
Entry Conditions: Price stabilizes after pulling back to the 51,400–51,500 zone; confirm support with a bullish close on the 15-minute or hourly chart; initiate a small long position.
Take-Profit: 51,800 (1st target); 52,050–52,100 (2nd target; reduce position/exit).
Stop-Loss: Exit immediately if the price breaks decisively below 51,040; do not hold the position in hopes of a recovery.
Short-term Short Strategy
Entry Conditions: Price faces resistance in the 51,800–52,100 range; hourly chart shows clear selling pressure and shrinking volume; initiate a small short position.
Take-Profit: 51,400; if broken, look toward 51,040.
Stop-Loss: Exit if the price closes firmly above 52,100.
Key Risk Warnings:
1. Macro-Fundamental Risks: US inflation, PCE, PMI, and consumer data, along with Federal Reserve official statements, can directly alter interest rate expectations. Fluctuations in US Treasury yields can cause significant gaps in the Dow Jones Industrial Average (DJIA), rendering technical patterns temporarily ineffective.
2. Component Stock Earnings Risks: As the 30 Dow component stocks release earnings, significant volatility in heavyweights like Goldman Sachs, IBM, and Johnson & Johnson can drive unusual index movements.
3. Liquidity and Gap Risks: Overnight news can lead to significant gaps (opening high or low) in US markets; leveraged trading carries risks of slippage and liquidation. Sudden geopolitical events over the weekend can cause Monday opening gaps, preventing stop-loss orders from executing at preset prices.
4. Technical Pattern Risks: The current market is in a consolidation phase within a downtrend; do not mistake a rebound for a new uptrend, as chasing longs at highs risks getting trapped. A low RSI reading does not guarantee an immediate rise; the indicator can remain "flat" (stagnant) for extended periods.
Disclaimer: The information contained herein (1) is proprietary to BCR and/or its content providers; (2) may not be copied or distributed; (3) is not warranted to be accurate, complete or timely; and, (4) does not constitute advice or a recommendation by BCR or its content providers in respect of the investment in financial instruments. Neither BCR or its content providers are responsible for any damages or losses arising from any use of this information. Past performance is no guarantee of future results.
More Coverage






2026 © - All Rights Reserved by BCR Co Pty Ltd
Risk Disclosure:Derivatives are traded over-the-counter on margin, which means they carry a high level of risk and there is a possibility you could lose all of your investment. These products are not suitable for all investors. Please ensure you fully understand the risks and carefully consider your financial situation and trading experience before trading. Seek independent financial advice if necessary before opening an account with BCR.
Jurisdiction Notice:Our services are not intended for residents of the United States & Canada, and we do not intend to distribute or use the provided information in any country or jurisdiction where it would be contrary to local law or regulation. It is important that you read and consider the relevant legal documents associated with your account, including the Terms and Conditions issued by BCR before you start trading. BCR Co Pty Ltd is regulated by the British Virgin Islands Financial Services Commission, Certificate No. SIBA/L/19/1122. The Registration Number in the BVI is 1975046. The Registered Address of the Company is Trident Chambers, Wickham’s Cay 1, Road Town, Tortola, British Virgin Islands.
BCR Co Pty Ltd (Company No. 1975046) is a company incorporated under the laws of the British Virgin Islands, with its registered office at Trident Chambers, Wickham’s Cay 1, Road Town, Tortola, British Virgin Islands, and is licensed and regulated by the British Virgin Islands Financial Services Commission under License No. SIBA/L/19/1122.
Open Bridge Limited (Company No. 16701394) is a company incorporated under the Companies Act 2006 and registered in England and Wales, with its registered address at Kemp House, 160 City Road, London, England, EC1V 2NX. Open Bridge Limited acts solely as a payment processor for BCR Co Pty Ltd and does not provide any financial, trading, or investment services on its behalf. Open Bridge Limited's role is limited to payment processing.


 English
 简体中文
简体中文
 繁體中文
繁體中文
 Bahasa
Melayu
Bahasa
Melayu
 Tiếng
Việt
Tiếng
Việt
 ไทย
ไทย
 日本語
日本語
 한국어
한국어
 ភាសាខ្មែរ
 español