


0
Currency & Commodity Analysis:
US Dollar Index
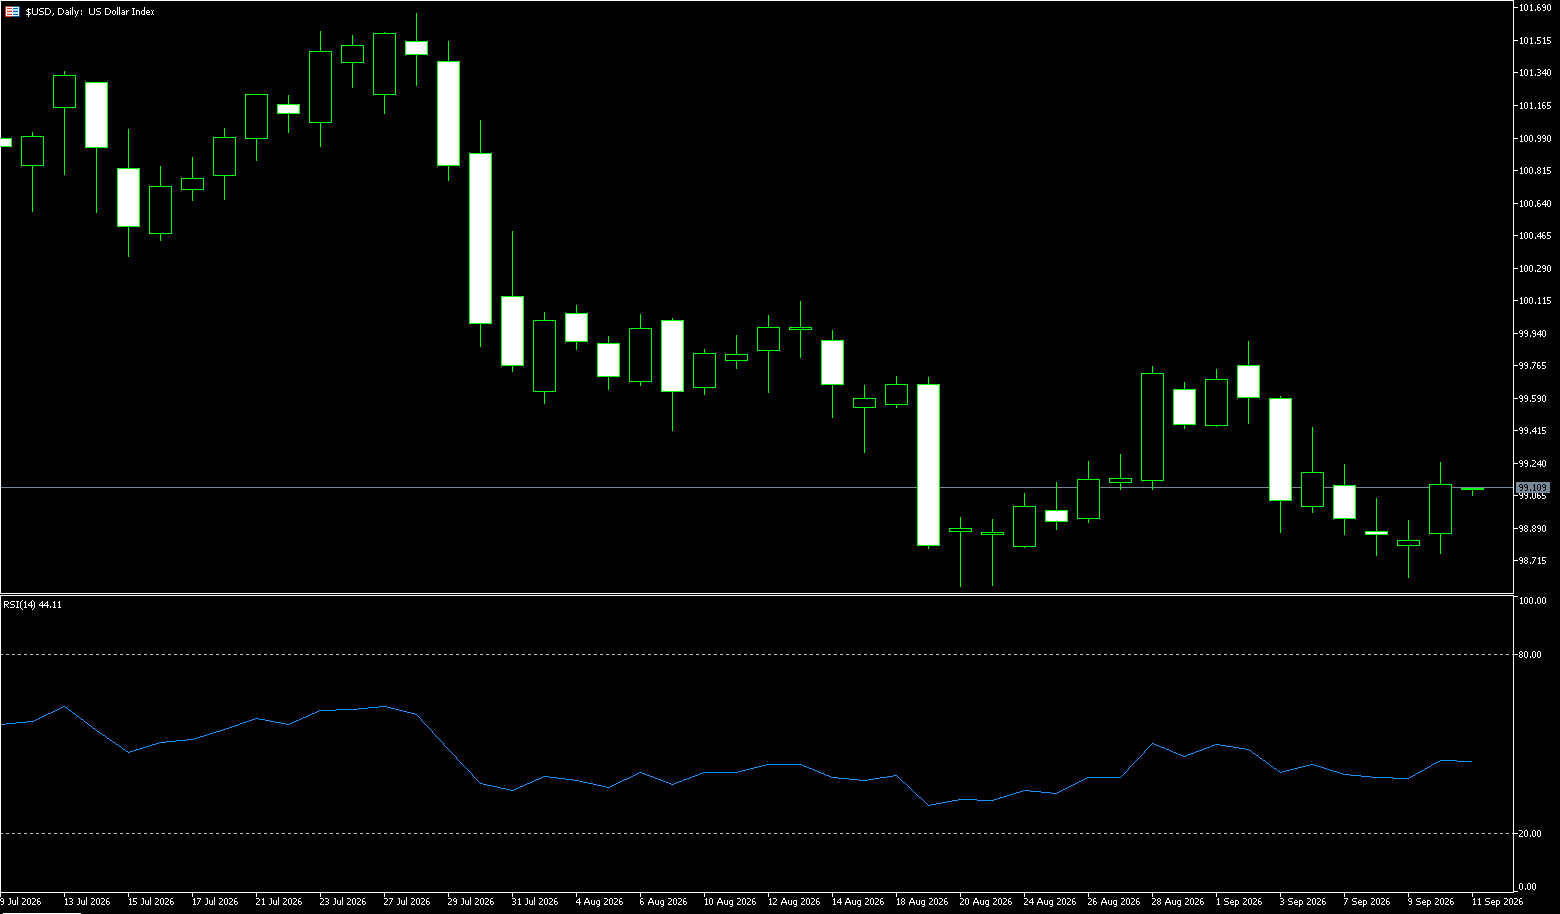
The US Dollar Index climbed to approximately 102.11 on Monday—briefly touching 102.60, its highest level since April 2025—driven by a sharp weakening of the euro amidst new political uncertainty in Spain, which exacerbated concerns regarding political instability and a deteriorating fiscal outlook in France. The dollar strengthened despite traders scaling back expectations for an imminent Federal Reserve rate hike following a weaker-than-expected US employment report. Data released on Friday showed the US economy added only 29,000 jobs in September—far below the expected 90,000—while the figure for August was revised down to 133,000. The unemployment rate rose to 4.2%, and annual wage growth unexpectedly slowed to 3.0%, the lowest rate since May 2021. Markets currently assign a nearly 80% probability that the Fed will leave policy unchanged this month, while the likelihood of a rate hike in December remains around 69%.
On the daily chart, the short-term outlook for the US Dollar Index spot remains bullish; prices have held steady above the 9-day simple moving average (101.33) and the middle Bollinger Band (100.51), reinforcing the underlying positive trend. However, the 14-day Relative Strength Index (RSI) stands at 76.34, indicating overbought conditions; this suggests that upward momentum is overextended and the index is more likely to undergo a corrective pause rather than embark on a new impulsive rally. Initial resistance lies at 102.53 (the week's high) and 102.62 (near the upper Bollinger Band); should overbought pressures intensify, buyers might begin to trim their positions. On the downside, initial support appears at the 5-day simple moving average (SMA) near 101.80, followed by the 9-day SMA at 101.33, which serves as a deeper trend support level. A more significant pullback could target the 101.00 psychological level, where broader buying interest would need to re-emerge to maintain the bullish structure.
Consider shorting the US Dollar Index at 102.20 today; Stop-loss: 102.30; Targets: 101.60, 101.70.
WTI Spot Crude Oil
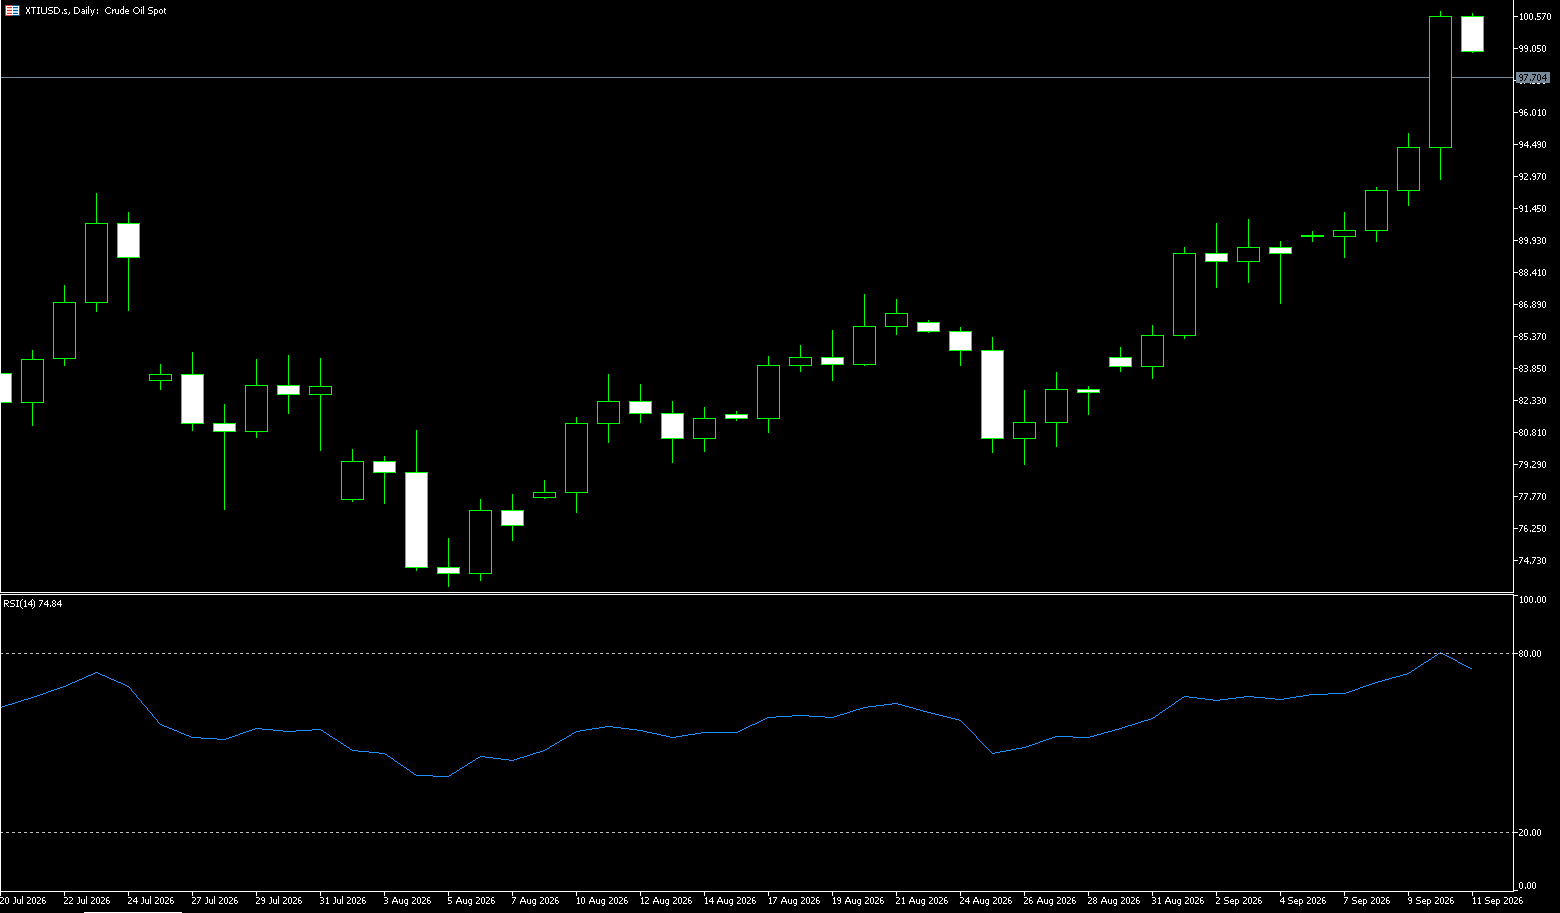
Crude oil prices fell below approximately $90 per barrel on Monday, extending their decline as signs of rising global supply outweighed concerns regarding ongoing geopolitical risks in the Middle East. Last Friday, the G7 agreed to release 100 million barrels of crude oil and diesel from emergency reserves while pledging not to impose restrictions on energy exports. Key OPEC+ members also agreed over the weekend to keep production quotas unchanged for the coming month, despite ongoing supply disruptions caused by the conflict in the Middle East. Meanwhile, data showed that during the final week of September, Persian Gulf crude exports exceeded pre-war levels on four out of the seven days, despite disruptions in the Strait of Hormuz and ongoing tensions between the US and Iran. In Yemen, Saudi-backed forces launched a full-scale military operation to retake territory held by the Houthis, following weeks of escalating tensions between the Saudi-led coalition and the Iran-backed group.
From a technical perspective, the commodity needs to establish a foothold below the 38.2% Fibonacci retracement level of the July-September rally to support further declines and test levels below $88.00. However, any further drop is more likely to attract new buyers and find solid support near the $85.00–$84.50 confluence zone—an area formed by the 50% Fibonacci retracement level and the 100-day simple moving average (SMA) at $84.49. Amidst mixed oscillator readings, this zone will serve as a critical level for crude oil prices. The Moving Average Convergence Divergence (MACD) remains below the zero line at -0.93, while the Relative Strength Index (RSI) hovers near the neutral 48.50 mark; this suggests the trend is decelerating but remains supportive rather than signaling a clear reversal. Nevertheless, a decisive break below $84.50 would pave the way for further declines toward the 61.8% Fibonacci retracement level at $80.73 and the 78.6% level at $74.84, eventually targeting the broader structural support level at $67.33. On the upside, a breakout would first target the resistance at the 23.6% Fibonacci retracement level of $94.13; further extension would open the way toward the cycle high zone near $102.40.
Consider going long on crude oil at $88.25 today; stop-loss: $88.10; targets: $90.00, $91.00.
Spot Gold
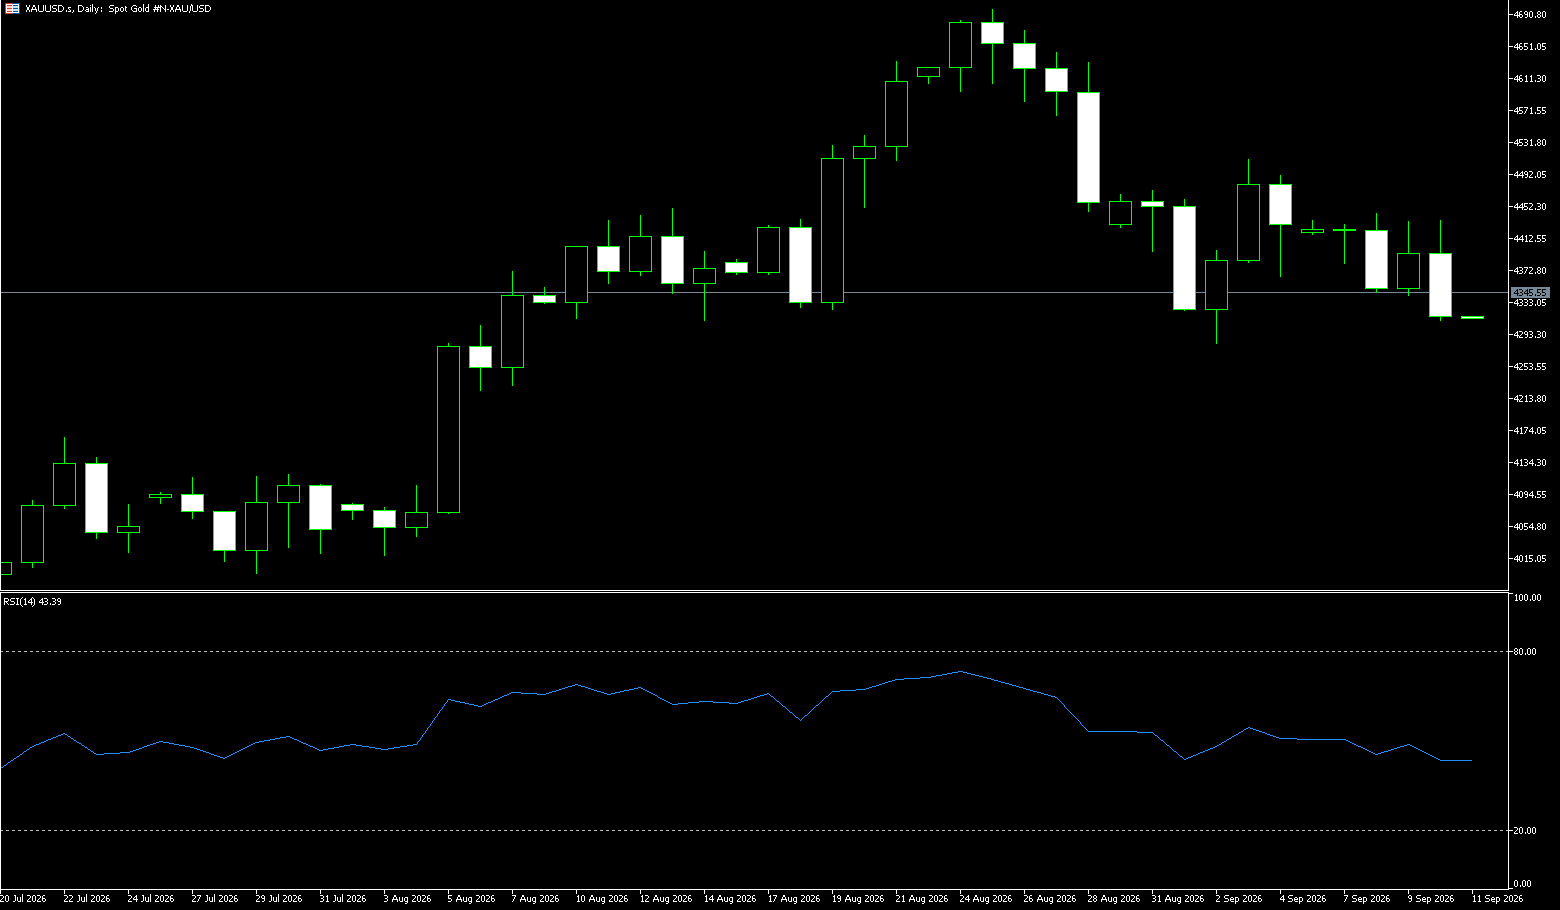
In early Monday trading, spot gold was hovering near $4,140 per ounce. While weaker-than-expected U.S. non-farm payroll data for September dampened expectations for Federal Reserve rate hikes—thereby boosting gold prices—market sentiment was dominated by tensions between the U.S. and Iran. Investors remained uneasy over the weekend after the Iranian parliamentary speaker stated that the Strait of Hormuz would not reopen until certain conditions were met. Last Friday, international gold prices closed lower again, posting a weekly decline of approximately 3.4%; U.S. gold futures fell 1%, settling at $4,162.30. Compounding the frustration for bulls, the disappointing U.S. jobs report initially triggered a surge of over 1% to $4,226.51, but the rally proved short-lived as the price was abruptly pushed back down by a rebounding U.S. dollar and elevated Treasury yields. All precious metals posted weekly losses. Wall Street sentiment has turned decidedly bearish, and for the first time since late July, retail investors have lost their bullish majority. Looking ahead, the battleground for gold this week will center on whether the $4,000 mark can hold.
Overall, last week's decline in gold prices was not driven by a single factor but was the result of a confluence of elements: a strengthening U.S. dollar, high Treasury yields, turmoil in European bond markets, dynamics involving oil prices and strategic reserve releases, and the Federal Reserve's hawkish stance. While the surprisingly weak Non-Farm Payrolls (NFP) data briefly ignited hopes among the bulls, it merely lowered the probability of an October rate hike without altering the core narrative of "higher for longer" interest rates. From a technical perspective, gold attempted a rebound after dropping to $4,110 (last week's low) early last week but faced selling pressure near $4,228 (last week's high). The $4,274 (20-day moving average) to $4,300 (round-number mark) range represents a stronger resistance zone, while $4,110 (last week's low) serves as a key psychological support level. If the US dollar and Treasury yields remain strong, gold prices could retest the $4,000 level; conversely, if European measures successfully restore market confidence or the bond market sell-off eases, gold could see a new wave of buying driven by global growth expectations, similar to the trend seen in 2020.
Consider going long on gold today at $4,132, with a stop-loss at $4,128 and targets at $4,170 and $4,180.
AUD/USD
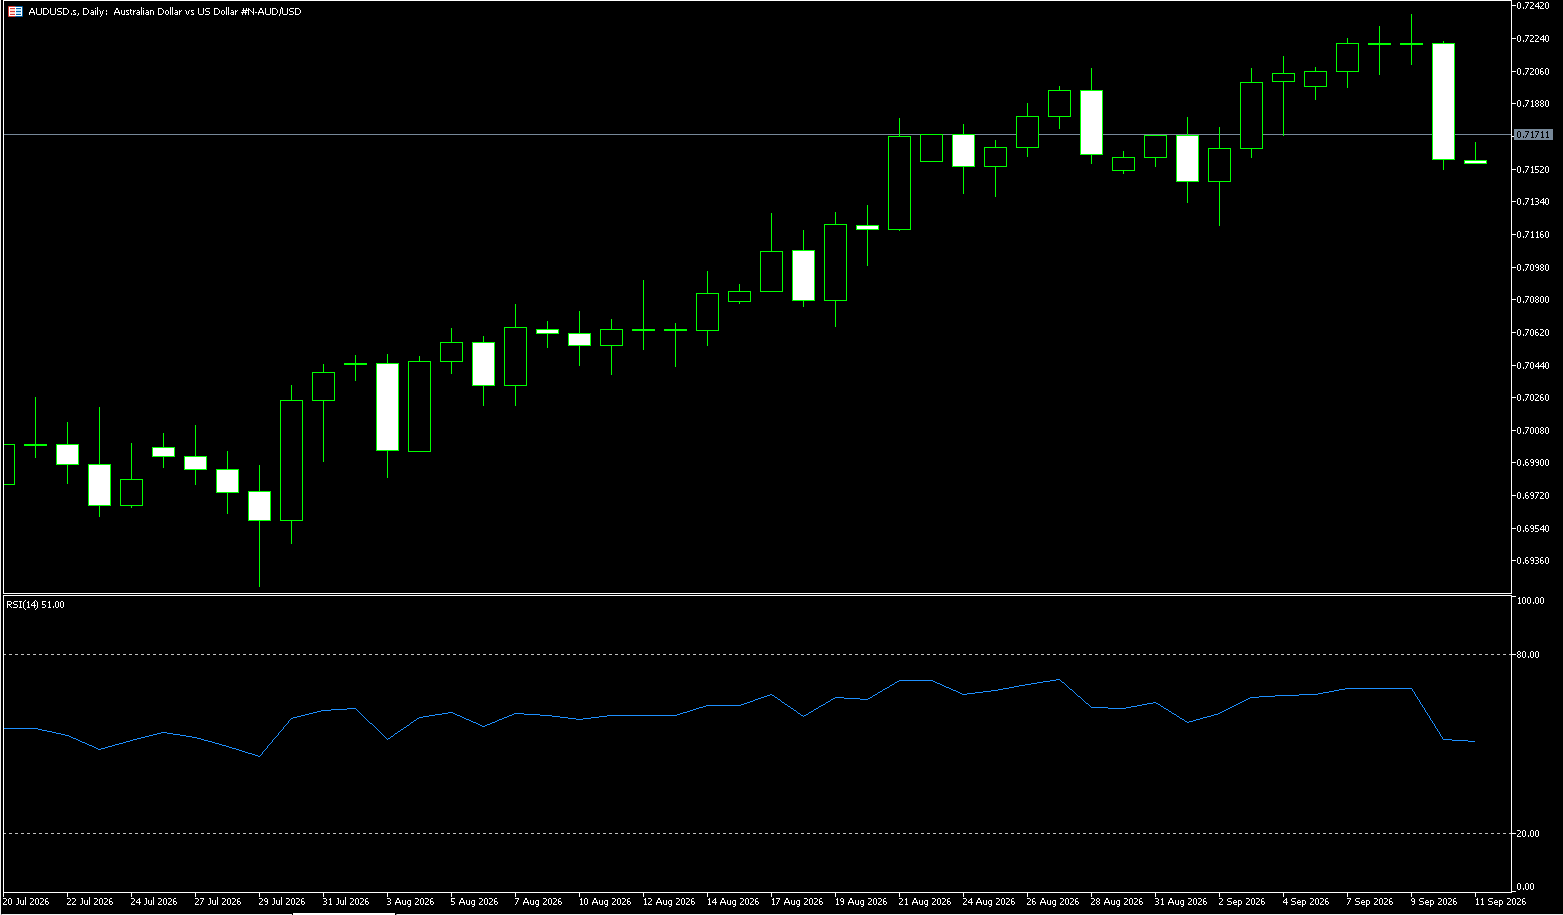
The AUD/USD pair retreated slightly after a modest gain the previous day, trading near 0.6970 during the European session on Monday. The pair remains under pressure due to a strengthening US dollar—driven by rising safe-haven demand amidst the deteriorating geopolitical situation in the Middle East. Investors are closely monitoring global risk sentiment while awaiting the US ISM Services PMI release later in the day for further guidance. Discussions regarding shifting expectations for Federal Reserve monetary policy continue to dominate market dynamics. Weaker-than-expected US employment data has led financial markets to price in a 77.9% probability that the Fed will keep benchmark interest rates unchanged at its upcoming policy meeting, up from 74% prior to the jobs report. Meanwhile, the Australian dollar continues to struggle following lower-than-expected August inflation data, which has dampened market expectations for another rate hike in November. Although the Reserve Bank of Australia raised the cash rate to a 15-year high of 4.6% in September, easing domestic price pressures leave the Australian dollar vulnerable amidst broader US dollar strength.
On the daily chart, AUD/USD is trading at 0.6970, extending its decline and breaking below both short- and medium-term simple moving averages (SMAs), keeping the short-term bias bearish. The 9-day (0.6984) and 14-day (0.7029) SMAs sit above the price, indicating continued downward pressure, with any rebound likely capped by these dynamic resistance levels. The 14-day Relative Strength Index (RSI) stands at 32, nearing oversold territory; this suggests that while the overall tone remains negative, the pace of the recent decline could slow if selling momentum wanes. To the upside, initial resistance lies near the 9-day SMA (0.6984), followed by a denser resistance zone near the 14-day SMA (0.7029), where any rally would face significant technical hurdles. To the downside, the next key support level is near last week's low of 0.6905, followed by 0.6894 (the lower Bollinger Band), which marks the structural bottom of the current bearish cycle; this is a critical zone to watch should selling resume after any brief corrective bounce.
Consider going long on AUD at 0.6960 today; Stop-loss: 0.6950; Targets: 0.7000, 0.7020.
GBP/USD
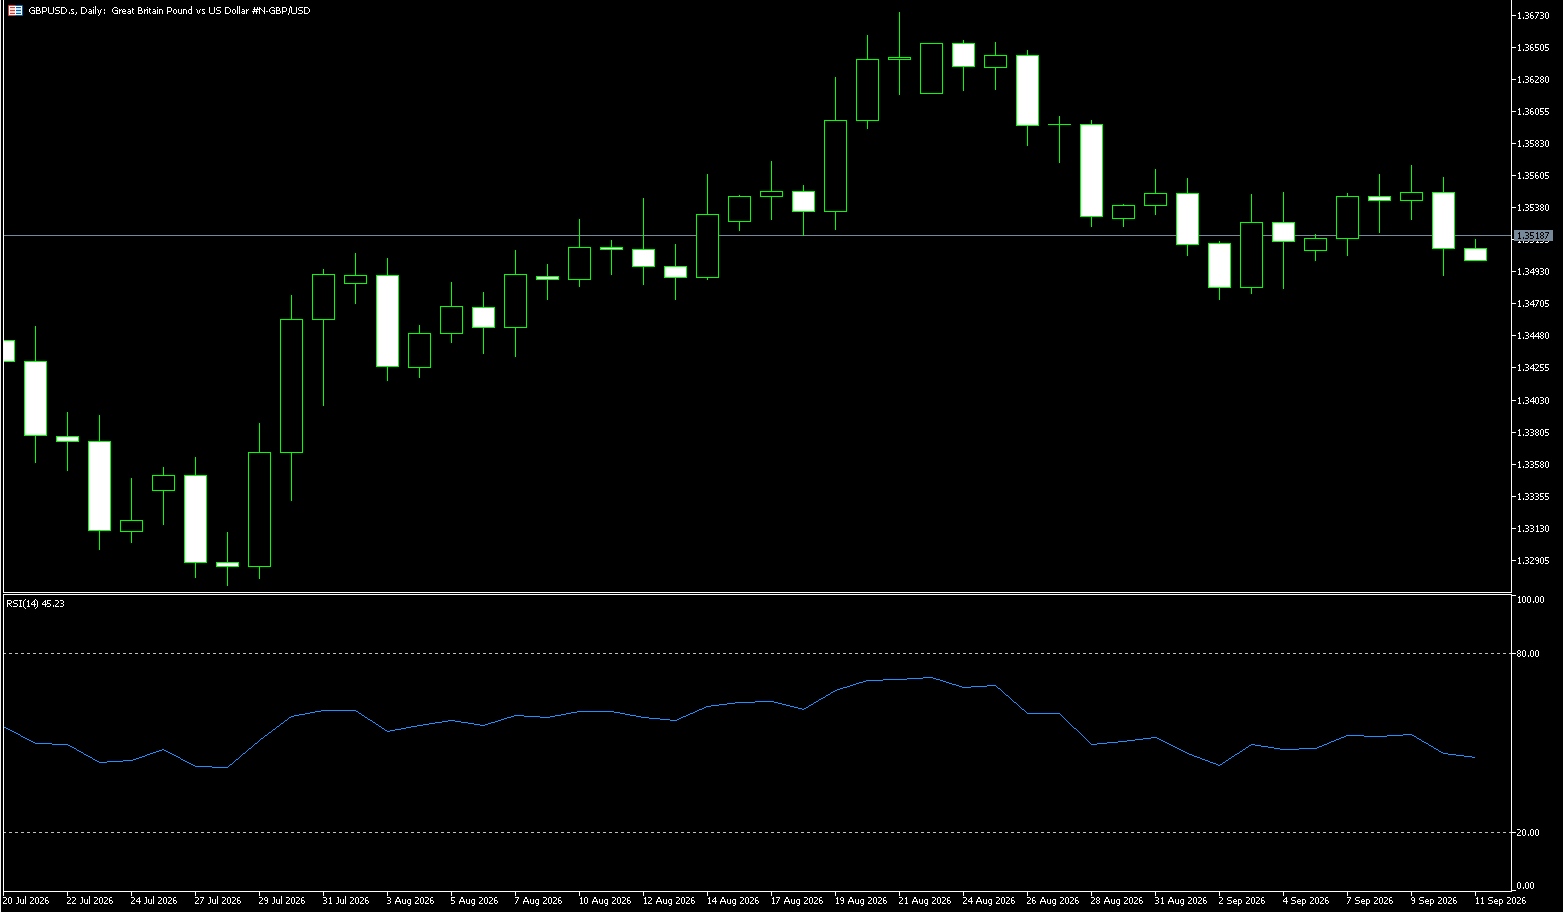
Sterling extended its gains above $1.32, rebounding from a three-month low, as weaker-than-expected US employment data weighed on the US dollar. The U.S. economy added only 29,000 jobs in September—far below the expected 90,000—reinforcing market expectations that the Federal Reserve might hold interest rates steady in October, while a rate hike in December is viewed as more likely. Meanwhile, markets anticipate the Bank of England will tighten policy by approximately 30 basis points by year-end and by about 90 basis points by the end of 2027. Several policymakers, including Governor Andrew Bailey, have signaled a greater openness to raising rates amid rising energy costs and the risk of inflation remaining persistently above target. Elsewhere, the British pound found support in comments from Andy Burnham, who—ahead of a summit expected around November 20—advocated for strengthening UK-EU relations, including the possibility of revisiting EU membership after the next general election.
On the daily chart, GBP/USD is trading near 1.3220; with the price remaining below both the 10-day Simple Moving Average (SMA) at 1.3244 and the 14-day SMA at 1.3281, the short-term outlook remains bearish. Trading below these key moving averages suggests that any rebound may be limited, while the 14-day Relative Strength Index (RSI) near 35 indicates persistent downward pressure rather than a clearly oversold condition. To the upside, the 14-day SMA at 1.3281 acts as immediate resistance, with a more significant barrier at the 1.3300 psychological level, reinforcing the broader bearish structure. As current indicators show no clear technical support, traders will look to the recent low of 1.3180 as a potential support level should the decline continue, with the next level of interest at 1.3107 (the lower Bollinger Band).
Consider going long on GBP at 1.3210 today; Stop Loss: 1.3200; Targets: 1.3280, 1.3270.
USD/JPY
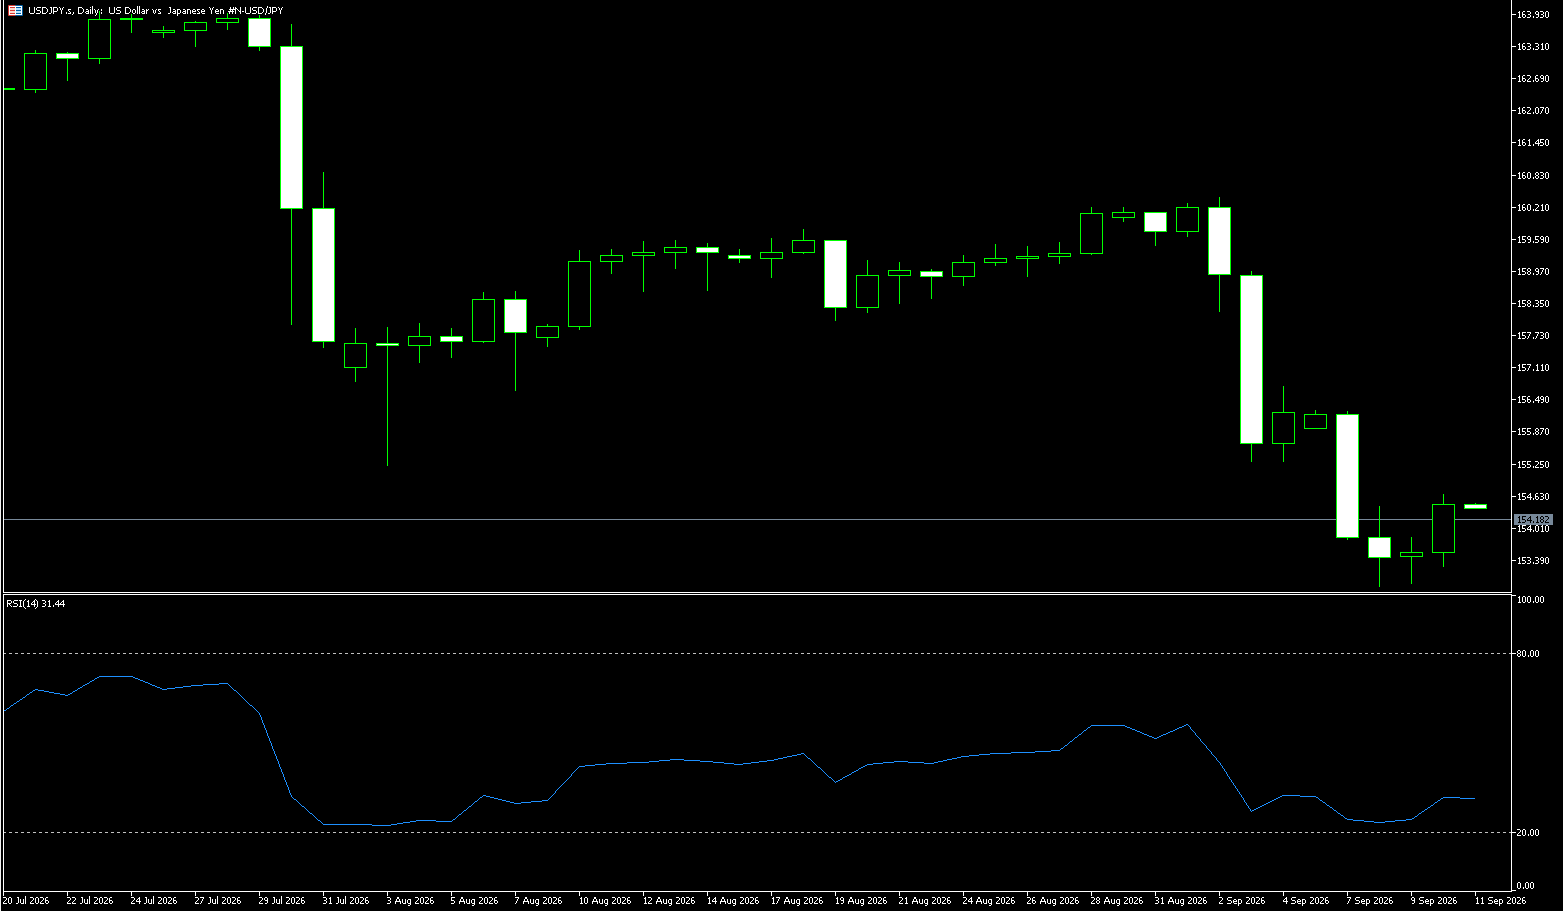
The yen fluctuated slightly around 157.80 per dollar on Monday, remaining within a sideways trading range established over the past two weeks as traders await a series of economic reports due this week. Key data releases include figures for August wages, the current account, and household spending, as well as September data on consumer confidence and machine tool orders. Last week, the summary of opinions from the Bank of Japan's September meeting highlighted growing concern regarding inflation exceeding the central bank's 2% target, hinting at a potential rate hike later this year, though little clarity was provided regarding the timing ahead of the October and December policy decisions. Meanwhile, although weaker-than-expected U.S. employment data eased pressure on the Federal Reserve to raise interest rates further, the Japanese yen remains under pressure from a strong U.S. dollar and elevated Treasury yields.
The USD/JPY exchange rate is generally trading in a high range, facing resistance after spikes; a close above 157.50 would signal a bullish bias, with initial targets at 158.50 followed by 159.00. The daily Relative Strength Index (RSI) is near 52—the midpoint of the range—meaning that even another pullback like the one seen when the data was released would not invalidate this outlook. This trading view would be negated if the daily close falls below 157.00. Support at 157.50 held firm during the data release period. Thursday's low was just above 157.00, with the next support level at 156.50, near the lows of September 28 and 30. Regarding resistance, 158.00 is the level below which USD/JPY retreated following the data release. Thursday's high, just below 158.50, serves as the next resistance level; a break above this would point toward the 159.00 mark.
Consider shorting the USD at 158.10 today; stop-loss: 158.30; targets: 157.20, 157.00.
EUR/USD
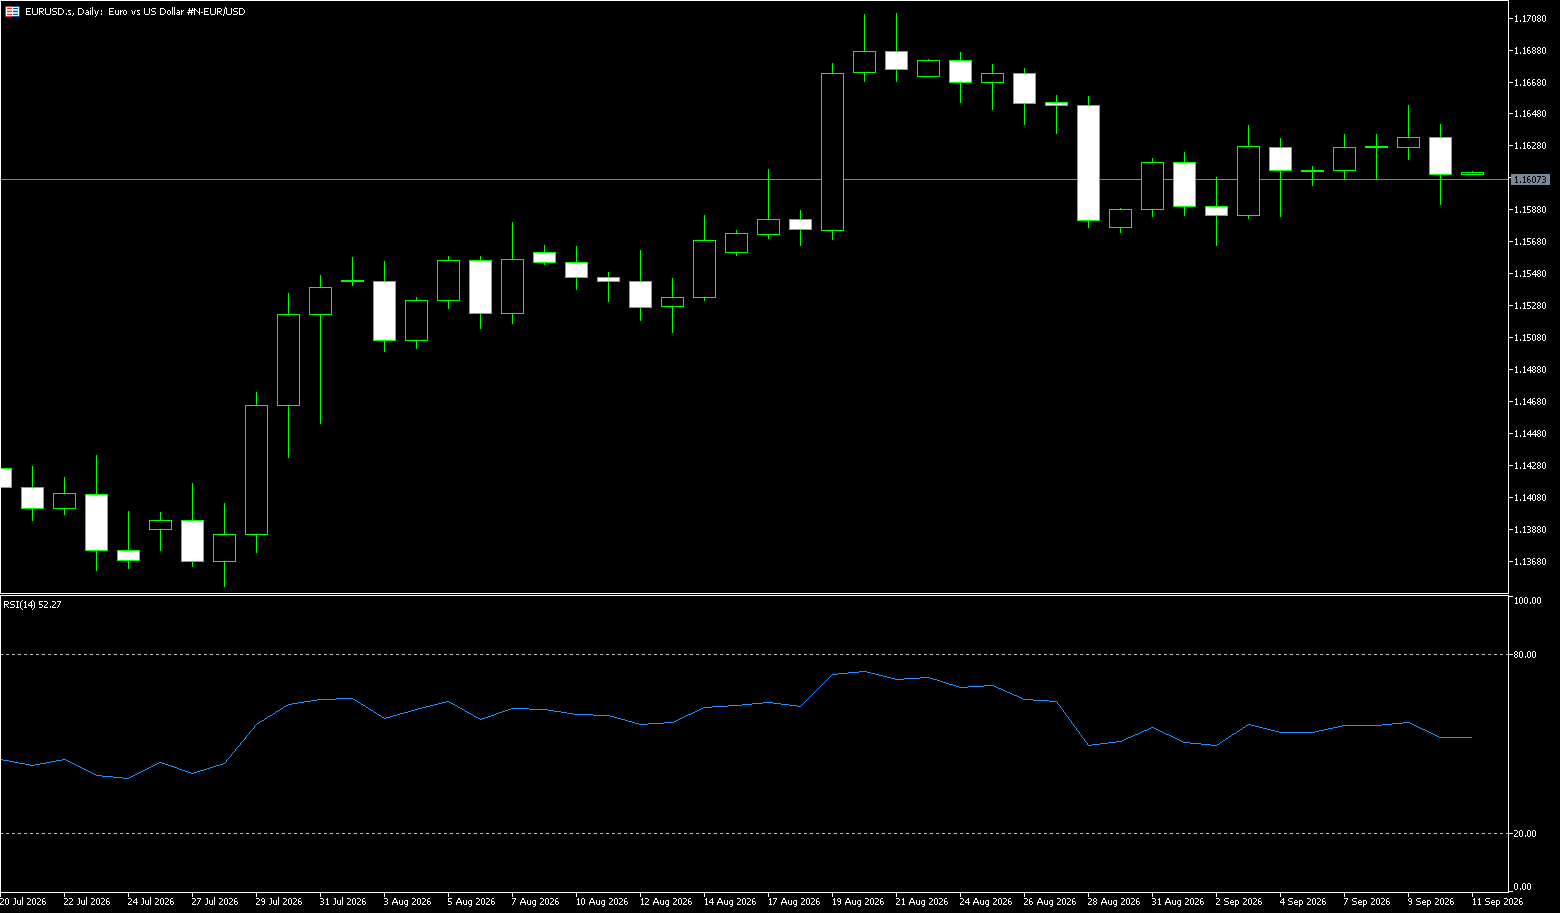
On Monday, the EUR/USD pair maintained a bearish tone following mixed service sector activity data and weak investor confidence figures, while concerns regarding France's fiscal situation weighed heavily on the euro. After rebounding earlier today from a 17-month low near 1.1160, EUR/USD is attempting to climb back above 1.1200, having fallen 3% over the past four weeks. Final data for the Eurozone HCOB Services PMI confirmed that activity in the sector grew at a pace of 53.0 in September, up from 51.7 in August. Similarly, the final German PMI reading was confirmed at 52.9, up from 49.7 the previous month. PMI growth in Italy and France slowed more than expected, whereas service sector activity in Spain outperformed forecasts. Additionally, the Eurozone Sentix Investor Confidence Index fell to 2.7 in October, down from 5.1 the prior month; however, on a positive note, Italy's public debt-to-GDP ratio dropped to 2% in the second quarter, down from 4.8% in the first quarter.
On the daily chart, EUR/USD is trading at 1.1220, maintaining a short-term bearish tone as the price remains below the 20-day Simple Moving Average (SMA) of 1.1276, which acts as immediate overhead resistance. The Relative Strength Index (RSI) is deeply oversold at 18.30, suggesting downside momentum is overextended; however, with the price still capped below the 5-day SMA, any attempted rebound is likely to face selling pressure near that resistance level. To the upside, the June 24 low of 1.13250 and the 20-day SMA at 1.1276 serve as key resistance levels for this major pair, ahead of the dynamic resistance provided by the 9-day SMA at 1.1323. To the downside, the pair may test the 1.1200 and 1.1189 (Bollinger Band lower limit) area. A break below this zone would expose the 1.1100 level.
Consider going long on the Euro today at 1.1210; Stop Loss: 1.1200; Targets: 1.1280, 1.1270.
Stock Analysis:
Australia ASX 200 Index
Market Overview:
The ASX 200 index closed virtually flat on Monday at 8,686 points; gains in electronic technology, consumer durables, and industrial services were offset by weakness in consumer staples, utilities, and retail trade. Early momentum faded as US stock index futures declined, and higher Treasury yields weighed on market sentiment ahead of the release of Federal Reserve meeting minutes later this week. Locally, the Melbourne Institute’s monthly inflation gauge rose 0.3% month-on-month in September—the smallest increase in three months—suggesting that tighter policies are curbing inflationary pressures, even though risks remain. Meanwhile, public holidays were observed in several Australian states, including New South Wales and Queensland.
Heavyweights BHP Group and Rio Tinto rose 1.1% and 0.7%, respectively. Meanwhile, Cochlear gained 4.2% and Atlas Arteria rose 2.9%. On the downside, Lynas Rare Earths fell 2.5%, Wisetech Global dropped 2.1%, and AMP declined 1.6%. The "Big Four" banks saw mixed results. Traders are now awaiting October consumer confidence data and September industry updates.
Sector Performance:
Top Gainers: The energy sector strengthened slightly, supported by oil prices; some gold miners rallied alongside precious metals.
Top Losers: Materials (mining) and financials (Big Four banks) came under pressure; cooling expectations for interest rate cuts weighed on heavyweight sectors, limiting the index's upside potential.
Technical Analysis:
On Monday, the ASX 200 fluctuated in early trading, influenced by US stock futures and iron ore/commodity prices. The index tested support levels multiple times during the session, and a tug-of-war between buyers and sellers late in the day resulted in a choppy candlestick pattern. With the 5-day and 20-day moving averages intertwined, the market is exhibiting a typical range-bound pattern with no clear directional trend. The RSI remains in the neutral zone, having entered neither overbought nor oversold territory; the MACD momentum bars have weakened slightly, indicating a balance between bullish and bearish forces with no clear dominance by either side. Monday’s session was characterized by range-bound consolidation and volatility; bulls attempted a rebound but were held back by heavyweight sectors, failing to break above the 8736 resistance level. Support at 8625 held firm for the time being as the market awaits a new catalyst.
Technical Outlook for Tuesday—Core Assessment: Continued range-bound oscillation while awaiting a directional breakout; a cautious stance within the range. Reference range: 8625–8736. Bullish Scenario (Optimistic): The index holds the 8625 support level at the open; bolstered by overnight strength in US stock futures and iron ore prices, it tests the 8736 resistance. A decisive break and hold above 8736 would open up room for a rebound, targeting 8814; however, a failure to hold 8736 after an initial spike would result in a pullback, signaling a "false breakout." Bearish Scenario (Cautious): The index breaks below 8625 at the open and fails to recover by the close, weakening the short-term trend and leading to a test of the 8496 support level. Indicator Expectations: The RSI is likely to continue fluctuating within the neutral zone; if the price approaches the upper bound and the RSI nears 70, resistance may trigger a pullback; if it approaches the lower bound and the RSI drops below 30, technical buying interest may emerge.
Trading Strategy (Short-term Perspective)
Range Trading Approach (Primary Strategy; currently most suitable)
Long on Pullback: If the price stabilizes near 8630 and forms a small bullish candle, initiate a light long position; place the stop-loss below 8610; target 8720–8736. Short on Rebound: If the price faces resistance near 8730 and shows signs of stalling (e.g., a stalling candlestick pattern), initiate a light short position; place the stop-loss above 8750; target the 8640 area. Breakout Strategy (Wait and See/Confirm First): To the upside—if the index holds firmly above 8,736 on high volume and overnight overseas markets are supportive, consider going long; stop-loss at 8,710, target at 8,814. Do not place long orders in advance to bet on a breakout. To the downside—if the index breaks decisively below 8,625, consider going short; stop-loss at 8,645, target at 8,496.
Key Risk Warnings:
1. External Macro Risks (Primary Uncertainty): Fluctuations in US stock futures, US Treasury yields, and iron ore/commodity prices can directly cause the ASX 200 to open with a gap, potentially breaching preset stop-loss levels immediately. Geopolitical conflicts in the Middle East could disrupt oil prices and safe-haven sentiment, triggering sudden spikes or drops.
2. RBA Interest Rate Expectation Risks: Inflation data remains volatile, and market expectations for rate cuts are subject to constant revision; if inflation exceeds expectations, it could weigh on the banking and real estate sectors, limiting the scope for a broader market rebound.
3. Sector Weighting Risks: The ASX 200 is heavily concentrated in the mining and banking sectors; a sharp drop in a single major commodity could rapidly drag down the index.
4. Trading Risks: Leveraged trading in stock index derivatives involves risks such as slippage during market gaps, meaning preset stop-loss orders may not execute at the intended price levels; volatile markets often see frequent "false breakouts," and excessive trading can easily lead to consecutive losses.
Japanese Stock Market Index (JP225)
Market Overview:
The Nikkei 225 index rose 2.4% on Monday, closing at 69,947 points—its highest level in three months—driven by gains in technology and financial stocks. Japanese markets followed Wall Street's upward trend from Friday, as US employment data came in lower than expected, easing concerns about further Federal Reserve rate hikes. However, investors remain cautious due to elevated bond yields and heightened uncertainty regarding the situation in the Middle East. In corporate news, SoftBank Group CEO Masayoshi Son—a staunch supporter of artificial intelligence—expressed ongoing concern regarding the safety risks posed by the rapid development of new machine capabilities, while simultaneously calling on nations to build trust and cooperate in harnessing this technology.
Gains in the technology and banking sectors were led by Advantest (4.3%), SoftBank Group (3%), Tokyo Electron (5.5%), Mitsubishi UFJ (2%), and Sumitomo Mitsui (1.6%).
Sector Performance:
Top-performing sectors: AI, semiconductor equipment (Advantest, Tokyo Electron), and SoftBank Group; MLCC materials also strengthened, with heavyweight tech stocks driving the index upward.
Laggard sectors: Energy and utilities—sectors sensitive to high dividend yields; capital continues to flow out as long-term bond yields remain elevated.
Technical Analysis:
Nikkei 225 Index closing: 69,946.86 points (up 1,637.40 points, or +2.40%). During the session, the index briefly surged past the psychological 70,000 mark before retreating due to afternoon profit-taking; the resulting candlestick featured a long upper shadow—a classic pattern of a high-level surge followed by a pullback. Following a series of bullish candles, Monday’s close showed a large bullish candle with a long upper shadow, indicating a short-term release of bullish momentum and a signal of selling pressure at high levels. While short-term moving averages remain in a bullish alignment and the upward trend structure is intact, the index has extended significantly from these averages, creating a need for a correction in the deviation rate. The market has entered overbought territory; bullish momentum is showing signs of marginal weakening, making it susceptible to profit-taking at any time. Key drivers: A rally in overnight US markets and continued foreign capital inflows; however, afternoon profit-taking by bulls reflects significant selling pressure at the 70,000 psychological level. Technical Outlook for Tuesday (Oct 6) — Core Assessment: Predominantly high-level oscillation; the priority is digesting profit-taking from Monday's long upper-shadow candle, with 70,000 acting as strong resistance. Scenario Analysis — Bullish Scenario: US stocks remain resilient overnight and the USD/JPY pair stays weak; the index holds the 69,200 level at the open and oscillates while attempting to retest 70,000. However, it is unlikely to firmly establish itself above 70,000, facing resistance and pulling back after the initial surge. Neutral Scenario (Highest Probability): Wide oscillation within the 69,200–70,000 range to digest Monday's long upper shadow; RSI retreats from overbought territory; high-level volatility shakes out weak hands. Bearish Scenario: US Treasury yields rise and the Yen rebounds sharply; the index breaks below 69,200 and tests 68,600, initiating a short-term pullback.
Trading Strategies:
1. Bullish Strategy
• Avoid chasing highs; wait for stabilization near 69,200 before considering long positions;
• Take Profit: Staged profit-taking in the 69,800–70,000 range;
• Hard Stop-Loss: 68,600; exit if the price breaks below this level; do not hold long positions.
2. Bearish Strategy (Betting on a pullback)
• Consider a light short position if upward momentum stalls near the 69,900–70,000 resistance zone;
• Take Profit: Reduce position at 69,200; target 68,600;
• Stop-Loss: Must exit if the price rises above 70,300.
Key Risk Warning:
1. Exchange Rate Risk (Primary Risk): A rapid strengthening of the USD/JPY pair would weigh on export-heavy stocks in the Nikkei index; rapid Yen appreciation could easily trigger a significant index pullback, given the strong correlation between stock and currency market movements. 2. Risk of US Treasury/Equity Correlation: A rise in the US 10-year Treasury yield and a sharp drop in US tech and AI stocks would directly impact heavily weighted Japanese semiconductor equipment stocks, causing the Nikkei index to plummet in tandem.
3. Risk of Concentrated Profit-Taking: After a sustained rally, the index sits at historical highs; the long upper shadow on Monday indicates intensifying profit-taking pressure, suggesting that a rapid, deep correction could occur if market sentiment weakens.
4. News-Driven Volatility: Statements by Bank of Japan officials, inflation data, geopolitical conflicts, and rising oil prices could all trigger sudden intraday price gaps.
Disclaimer: The information contained herein (1) is proprietary to BCR and/or its content providers; (2) may not be copied or distributed; (3) is not warranted to be accurate, complete or timely; and, (4) does not constitute advice or a recommendation by BCR or its content providers in respect of the investment in financial instruments. Neither BCR or its content providers are responsible for any damages or losses arising from any use of this information. Past performance is no guarantee of future results.
More Coverage






2026 © - All Rights Reserved by BCR Co Pty Ltd
Risk Disclosure:Derivatives are traded over-the-counter on margin, which means they carry a high level of risk and there is a possibility you could lose all of your investment. These products are not suitable for all investors. Please ensure you fully understand the risks and carefully consider your financial situation and trading experience before trading. Seek independent financial advice if necessary before opening an account with BCR.
Jurisdiction Notice:Our services are not intended for residents of the United States & Canada, and we do not intend to distribute or use the provided information in any country or jurisdiction where it would be contrary to local law or regulation. It is important that you read and consider the relevant legal documents associated with your account, including the Terms and Conditions issued by BCR before you start trading. BCR Co Pty Ltd is regulated by the British Virgin Islands Financial Services Commission, Certificate No. SIBA/L/19/1122. The Registration Number in the BVI is 1975046. The Registered Address of the Company is Trident Chambers, Wickham’s Cay 1, Road Town, Tortola, British Virgin Islands.
BCR Co Pty Ltd (Company No. 1975046) is a company incorporated under the laws of the British Virgin Islands, with its registered office at Trident Chambers, Wickham’s Cay 1, Road Town, Tortola, British Virgin Islands, and is licensed and regulated by the British Virgin Islands Financial Services Commission under License No. SIBA/L/19/1122.
Open Bridge Limited (Company No. 16701394) is a company incorporated under the Companies Act 2006 and registered in England and Wales, with its registered address at Kemp House, 160 City Road, London, England, EC1V 2NX. Open Bridge Limited acts solely as a payment processor for BCR Co Pty Ltd and does not provide any financial, trading, or investment services on its behalf. Open Bridge Limited's role is limited to payment processing.


 English
 简体中文
简体中文
 繁體中文
繁體中文
 Bahasa
Melayu
Bahasa
Melayu
 Tiếng
Việt
Tiếng
Việt
 ไทย
ไทย
 日本語
日本語
 한국어
한국어
 ភាសាខ្មែរ
 español