


null
USD
On Tuesday, September 12th, during the U.S. trading session, the U.S. dollar regained some of its losses as investors awaited U.S. inflation data, including the Consumer Price Index (CPI), set to be released on Wednesday. The U.S. dollar index rose by 0.02%, now trading at 104.54. Earlier in the week, the U.S. dollar had declined ahead of the release of key U.S. inflation data for the week. Comments from the Bank of Japan Governor Haruhiko Kuroda raised hopes of Japan soon moving away from negative interest rates, leading to a significant rise in the Japanese yen. Additionally, the sharp appreciation of the Chinese yuan against the U.S. dollar, although not part of the U.S. dollar index basket, could influence market sentiment. The U.S. dollar index retreated in the absence of economic news, possibly influenced by potential interventions by the People's Bank of China, dropping to around 104.50. Earlier, a series of resilient economic data had increased investors' bets on the Federal Reserve possibly raising interest rates further, causing a surge in the U.S. dollar and U.S. Treasury yields last week.
On the daily chart, after breaking below the support provided by the late-May high of 104.70, the U.S. dollar index found support near the 10-day (104.40) and 25-day (103.78) moving averages, both trending upwards, and the price action remains within an upward channel. The overall trend still leans towards the upside. If the index manages to reclaim 104.70, it is expected to retest last week's high of 105.15 and the key resistance at 105.37, which is constructed based on the 38.2% Fibonacci retracement level from the overall downtrend between the September 2022 high of 114.77 and the July 2023 low of 99.57. However, the formation of a bearish signal with last week's high doji followed by a large bearish candlestick, along with an overbought correction signal from the KDJ indicator, suggests the possibility of a significant pullback or even a temporary peak. Initial support could be found around 104.05 (lower channel line). If this support is breached, the next significant level to watch would be 103.42 (220-day moving average).
Considering the above analysis, it may be prudent to consider shorting the U.S. dollar index near 104.72 today, with a stop loss at 104.90 and target levels at 104.22 and 104.15.

WTI Spot Crude Oil
Yesterday, oil prices reached a new recent high at $88.70 per barrel. Last Friday, crude oil prices briefly rose to their highest level since November of the previous year. The upcoming release of the U.S. Consumer Price Index (CPI) data could have an impact on WTI prices, as these data may signal further interest rate hikes. Oil prices may still be supported by the promised supply cuts from Saudi Arabia and Russia. Another factor supporting WTI prices is the storm and flooding in eastern Libya, which has led to the closure of four major oil export ports since last Saturday. Concerns about the Chinese economy have affected the outlook for fuel demand. The upcoming release of the U.S. Consumer Price Index (CPI) data could have an impact on WTI prices, as these data may signal further interest rate hikes. Oil prices may still be supported by the promised supply cuts from Saudi Arabia and Russia. Another factor supporting WTI prices is the storm and flooding in eastern Libya, which has led to the closure of four major oil export ports since last Saturday. This week, the International Energy Agency and the Organization of the Petroleum Exporting Countries will release their monthly reports, and investors should pay close attention.
Although WTI crude oil has been in a narrow range between $84.50 and $87.50 over the past week, the closing price has remained above $86.0 per barrel. This level marks the highest closing price for WTI crude oil since November 2022, suggesting that the medium-term trend of oil prices may have turned upward. Overall, from a technical perspective, oil prices are seen as bullish in the medium term. While short-term corrections are possible, the longer-term consolidation suggests strong bullish sentiment. If WTI crude oil stabilizes above $86.0, the next potential targets could be $89.36 (123.6% Fibonacci retracement level from $84.51 to $63.93), with a further target of $90.00 (a psychological level). On the downside, initial support levels to watch include $85.13 (23.6% Fibonacci retracement from $77.49 to $87.50) and $84.51 (April high). The next level to watch would be $83.67 (38.2% Fibonacci retracement from $77.49 to $87.50).
Considering the above analysis, it may be advisable to consider going long on crude oil near $87.70 today, with a stop loss at $87.40 and target levels at $88.80 and $89.20.

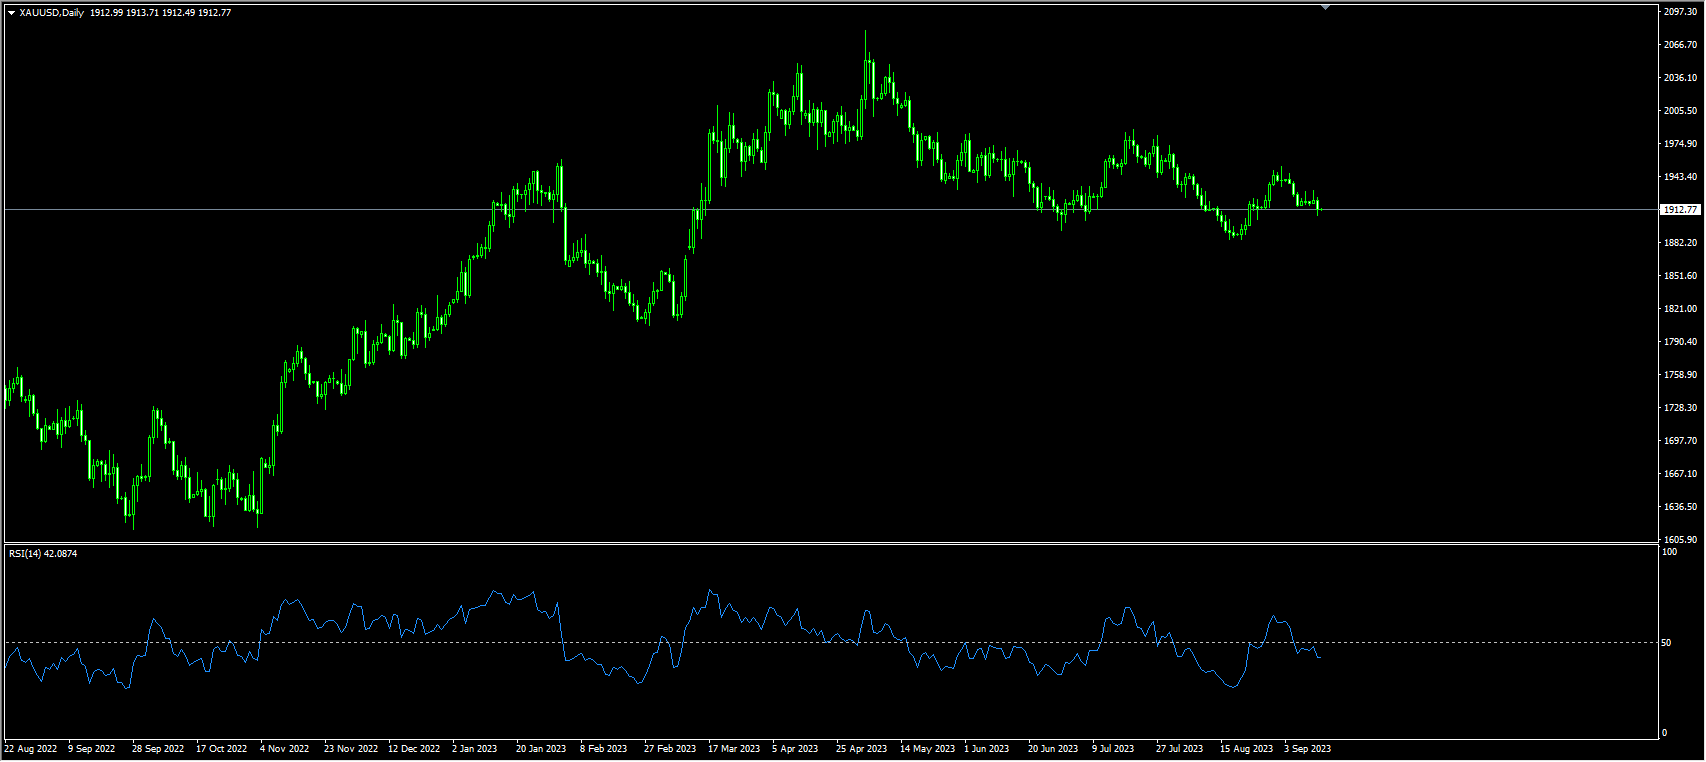
XAUUSD
As oil prices reached their highest level in 2023, it triggered concerns among investors about a global economic slowdown, leading to a decline in the stock market. Additionally, a rebound in the U.S. dollar caused gold prices to briefly dip below $1,910 and reach a low of $1,907.50 on Tuesday as investors prepared for Wednesday's U.S. inflation data. On Monday, September 11th, gold prices rose, marking the best trading day in nearly a week and a half. Prices briefly broke through the $1,930 per ounce level but ultimately retreated to just below $1,920. The recent increase in domestic gold prices in the Chinese market is influenced both by exchange rates and increased consumer demand as the traditional Chinese holiday approaches. With these combined factors, the international gold market is generally trending upwards, especially as the Federal Reserve's rate-hiking cycle comes to an end, which could push gold prices towards historical highs. For gold traders, the most critical economic data this week will be the U.S. August CPI and PPI, and market participants will also pay attention to U.S. August retail sales data and the European Central Bank's interest rate decision, with CPI and the European Central Bank potentially being decisive factors in gold's performance this week.
From a short-term technical perspective, before the release of the U.S. CPI data this week, gold prices may continue to be constrained between $1,910 (61.8% Fibonacci retracement level from $1,804 to $2,081) and $1,938 (daily chart major triangle resistance line). The Relative Strength Index (RSI) has shown a slight uptick but still remains slightly below the midline at 48.15. Therefore, the risk appears to be tilted towards a downward movement in gold prices. However, gold sellers would need to overcome the short-term resistance level at $1,938 to potentially test higher levels at $1,948.80 (100-day moving average) and, upon breaking through $1,948, look towards the $1,963.20 (76.4% Fibonacci retracement level from $1,987.50 to $1,884.90) area. If gold prices continue to fall below $1,910.00, they could challenge the $1,900 (a psychological level).
Considering the above analysis, it may be advisable to consider shorting gold before $1,916 today, with a stop loss at $1,920 and target levels at $1,907 and $1,903.
AUDUSD
At the beginning of the week, in the backdrop of a weaker U.S. dollar, the Australian dollar (AUD/USD) rose to a high of 0.6450, marking its best single-day performance since late July. With a lack of major market catalysts, the decline in the U.S. dollar was likely driven by profit-taking behavior in the market. Although the Australian dollar has shown signs of a temporary recovery after several months of sharp declines, this rebound is likely to be short-lived. One variable that could reignite weakness in the AUD/USD is U.S. economic data. The resilience of the U.S. economy could push the Federal Reserve to implement further interest rate hikes. If official data shows unexpectedly strong performance compared to market expectations, this would favor the U.S. dollar as it could strengthen expectations of the Fed raising rates further in November. In this context, the AUD/USD could face selling pressure. Apart from this week's risk events, it's also important to closely monitor developments in China. As Australia's major trading partner, China holds a crucial position. If the Chinese government chooses to implement more comprehensive and substantive support measures to boost economic recovery, the Australian dollar would be in a more favorable position to sustain a lasting rebound.
At the beginning of the week, the AUD/USD rebounded from near the support at 0.6357, marking a potential "double bottom" formation with its neckline at 0.6522. Double bottoms are typically considered reversal patterns, and if the AUD/USD completes the construction of a "W" bottom and successfully breaks above the 0.6522 neckline resistance, the bullish double bottom pattern would be confirmed, with potential targets at 0.6562 (38.2% Fibonacci retracement level from 0.6895 to 0.6357) and 0.6568 (50-day moving average). If the AUD/USD exchange rate fails to rise and instead falls, breaking below the previous low of 0.6357, it could challenge levels at 0.6272 (November 3rd, 2022 low) and 0.60 (a psychological level).
Considering the above analysis, it may be advisable to consider going long on the Australian dollar before 0.6400 today, with a stop loss at 0.6380 and target levels at 0.6470 and 0.6485.

GBPUSD
At the beginning of the week, the British pound (GBP) saw a minor rebound above the 1.25 level, largely benefiting from indirect support due to verbal intervention by the Bank of Japan, which caused a slight softening of the U.S. dollar. The Bank of England is set to meet next week to discuss monetary policy. Traders believe there is a 70% chance that the Bank of England will raise interest rates by 25 basis points to 5.50%. However, they have reduced the probability of further rate hikes afterward, which is a significant departure from the situation a week ago when the money market indicated that UK rates were expected to peak at close to 5.7% by March. One reason the pound has been strong this year is that many believe the Bank of England has more work to do in reducing inflation, thus requiring higher interest rates than many other central banks. However, as data on the UK economy has turned less favorable in recent weeks, several prominent institutions have suggested that the UK's rate-hiking cycle may have come to an end, making it difficult for the pound to gain much upward momentum in the coming weeks.
On the daily chart, the GBP/USD continues to be pressured below short-term moving averages, showing an overall bearish bias. The support at the current low of 1.2446 is crucial, and if broken, the pound-dollar pair may continue to explore lower levels. To reverse the recent downtrend, it would need to break above 1.2746 (August 30th high). The GBP/USD saw a minor increase at the beginning of the week but remains constrained by the 10-day moving average, currently at the 1.2563 level, and the 1.2605 level (centerline of the descending channel). There are no clear signs of a breakout from the bearish trend at the moment. To indicate a potential bottoming and rebound for the pound, it would need to clearly break through this zone. Resistance levels beyond that are estimated at the 100-day moving average of 1.2654, with the next level at 1.2746. Support levels are estimated at the 200-day moving average of 1.2420, followed by 1.24 and the May 25th low of 1.2306. If the GBP/USD falls back below 1.25 and breaks the previous low of 1.2446 once again, its exchange rate may challenge the 1.2380 level (a support trendline originating from the April 3rd low of 1.2275).
Considering the above analysis, it may be advisable to consider shorting the British pound before 1.2510 today, with a stop loss at 1.2540 and target levels at 1.2450 and 1.2440.

USDJPY
At the beginning of the week, the Governor of the Bank of Japan, Haruhiko Kuroda, stated that if the Bank of Japan is confident it can achieve its inflation target, it may end its negative interest rate policy. This suggests that they may be closer to abandoning the negative interest rate policy by the end of the year if a significant shift occurs, but there is still a long way to go. It's evident that the Bank of Japan is still employing its usual approach. In the current trading environment, driven by the strong performance of the U.S. economy, the Bank of Japan seems reluctant to use real monetary ammunition and is sticking to verbal warnings in an attempt to curb the rapid depreciation of the yen. History often shows that verbal interventions by the Bank of Japan tend to have limited effectiveness.
In terms of recent trends, although the USD/JPY has once again moved away from the year's high at the 147.87 level, it's clear that USD bulls are not ready to halt their advances. The USD/JPY continues to operate within an upward channel, and if it manages to break through the aforementioned year's high of 147.87 and the 148.80 level (upper boundary of the upward channel), it could potentially target the 150 level. However, the RSI technical indicator is showing signs of bearish divergence, so caution should be exercised to guard against the risk of intervention by the Bank of Japan. On the downside, if it falls below the Monday low of 145.90, it could temporarily halt the USD's upward momentum. This could lead to further downside testing of the 144.12 level (42-day moving average) and the 144.11 level (38.2% Fibonacci retracement from 138.05 to 147.87), potentially confirming a shift towards a downtrend targeting 140.00.
Considering the above analysis, it may be advisable to consider shorting the U.S. dollar before 147.40 today, with a stop loss at 147.70 and target levels at 146.20 and 146.10.

EURUSD
According to the latest forecasts released by the European Commission on Monday, the GDP growth of the Eurozone for 2023 is expected to be 0.8%, down from the previous forecast of 1.1%. The GDP growth forecast for next year has also been lowered by a similar magnitude to 1.3%. Germany, as the largest economy in the region, was originally expected to achieve economic growth of 0.2% in 2023, but it now faces a contraction of 0.4%. The downward revision in the economic growth forecast for the Netherlands is even more significant, going from 1.8% to 0.5%. On the other hand, inflation in the Eurozone is expected to remain high and not fall to the European Central Bank's target of 2% before next year, further reinforcing concerns about stagflation. As a result, there is now a divergence in the market regarding whether the ECB will continue to raise interest rates. It can be said that the euro currently lacks strong support factors on the macroeconomic front. Investors are currently focused on the ECB's interest rate meeting on Thursday and the results of inflation data released in the United States on the same day.
Recent data shows that the overall economic growth expectations for the Eurozone remain weak, which will continue to put pressure on the euro's trend. Various unfavorable factors, including geopolitical risks within the region, are expected to make it difficult for the euro to gain significant support until there is a complete reversal in the trend of the US dollar. Prior to that, the EUR/USD is receiving some support from short-covering and position adjustments, temporarily holding above the 1.07 level. However, the overall bearish bias remains unchanged. Keep an eye on the near-term support levels at 1.07; if broken, the euro could accelerate its decline towards 1.0650 (a support trendline extending from the low point of 1.0482 earlier this year) and 1.0610 (38.2% Fibonacci retracement from 0.9535 to 1.1275). The EUR/USD will only open up a rebound towards the 200-day moving average at 1.0825 after finding support near the September 1st low of 1.0772.
Today, it is suggested to go long on the euro at 1.0725 with a stop loss at 1.0695 and target levels at 1.0785 and 1.0795.

Disclaimer: The information contained herein (1) is proprietary to BCR and/or its content providers; (2) may not be copied or distributed; (3) is not warranted to be accurate, complete or timely; and, (4) does not constitute advice or a recommendation by BCR or its content providers in respect of the investment in financial instruments. Neither BCR or its content providers are responsible for any damages or losses arising from any use of this information. Past performance is no guarantee of future results.
More Coverage


Risk Disclosure:Derivatives are traded over-the-counter on margin, which means they carry a high level of risk and there is a possibility you could lose all of your investment. These products are not suitable for all investors. Please ensure you fully understand the risks and carefully consider your financial situation and trading experience before trading. Seek independent financial advice if necessary before opening an account with BCR.
Jurisdiction Notice:Our services are not intended for residents of the United States & Canada, and we do not intend to distribute or use the provided information in any country or jurisdiction where it would be contrary to local law or regulation. It is important that you read and consider the relevant legal documents associated with your account, including the Terms and Conditions issued by BCR before you start trading. BCR Co Pty Ltd is regulated by the British Virgin Islands Financial Services Commission, Certificate No. SIBA/L/19/1122. The Registration Number in the BVI is 1975046. The Registered Address of the Company is Trident Chambers, Wickham’s Cay 1, Road Town, Tortola, British Virgin Islands.

 English
 简体中文
简体中文
 繁體中文
繁體中文
 Bahasa
Melayu
Bahasa
Melayu
 Tiếng
Việt
Tiếng
Việt
 ไทย
ไทย
 日本語
日本語
 한국어
한국어
 ភាសាខ្មែរ
 español