


null
USD
Due to the surge in oil prices leading to an overall increase in inflation, consumer prices in the United States rose slightly in August. However, the core Consumer Price Index (CPI) continued to trend downward. The Dollar Index saw little change. While strong inflation data is unlikely to shake the expectation of the Federal Reserve keeping interest rates unchanged in next week's policy statement, it may increase expectations of further rate hikes in upcoming meetings. The Dollar Index experienced its largest single-day drop since July earlier this week. Part of the dollar's strength is driven by the recent sharp rise in oil prices. Midweek, WTI crude oil futures briefly surpassed $89 per barrel and reached their highest level since November 2022. Higher energy costs may keep the Federal Reserve vigilant to ensure that monetary policy remains restrictive for an extended period to bring inflation back to the target level of 2% sustainably. Currently, the market believes that the bearish fundamentals for the dollar this week have already been established, and Bank of Japan Governor Kuroda merely provided the necessary catalyst.
Last week, the Dollar Index broke above the trendline resistance, effectively surpassing the May high of 104.70, and briefly exceeded the 105.00 threshold to reach 105.15, the highest level in several months. Given that short-term upward momentum is clearly dominating the market, the Dollar Index is still expected to maintain its upward trajectory, especially if it successfully holds above the technical support at 104.07 (240-day moving average). In this context, the subsequent Dollar Index is expected to rise again towards 105.15 (last week's high) and the strong resistance at 105.37 (38.2% Fibonacci retracement level of the overall decline from 114.77 to 99.57). If it continues to rise, the Dollar Index may revisit the March high of 105.88. Conversely, if bears reenter the market and trigger a decline in the Dollar Index, initial support should be watched around the 104.07 level, with further attention to the important level of 102.93 (August 30th low) if broken.
Today, it may be considered to short the Dollar Index near 104.90, with a stop loss at 105.05 and targets at 104.35 and 104.25.

WTIUSD
Yesterday, crude oil prices hit a new high for the year, with WTI crude oil reaching a peak of $88.95 per barrel, the highest in 10 months. The rise is mainly attributed to the optimistic monthly report from OPEC, which predicts strong oil demand for this year, despite ongoing oil production cuts by Saudi Arabia and Russia. OPEC maintains the belief that global oil demand will grow strongly in 2023 and 2024, citing signs that major economies are growing stronger than expected. The organization anticipates a global oil demand increase of 2.25 million barrels per day by 2024. Crude oil prices are rebounding after the OPEC monthly report showed that the oil market is much tighter than originally thought. Additionally, the U.S. Energy Information Administration raised its forecasts for crude oil prices in 2023 and 2024, and it is expected that global oil inventories will decline by the end of this year after Saudi Arabia decided to extend its 1 million barrels per day production cut plan until year-end.
WTI crude oil, after consolidating in a narrow range for five trading days, continued to rise and approached the $90 mark, in line with market expectations. Given that WTI crude oil has broken through the "double top" highs at $83.50 formed in April and August of this year, the medium-term trend of oil prices may have shifted to the upside. Overall, there is a bullish outlook for oil prices in the medium term, although short-term corrections cannot be ruled out. The $83.50 level has now become a strong support, and if WTI crude oil further stabilizes above the recent five-day highs in the range of $87.20 to $87.50, it is likely to continue to rise to $89.36 (123.6% Fibonacci retracement level from $84.51 to $63.93) and the psychological level of $90.00.
Today, it may be considered to long crude oil near $87.80, with a stop loss at $87.40, and targets at $88.95 and $89.20.

XAUUSD
In August, the seasonally adjusted core CPI (Consumer Price Index) in the United States recorded an annual rate of 4.3%, reaching its lowest point since September 2021 and declining for the sixth consecutive month. The seasonally adjusted CPI for August showed a monthly rate of 0.6%, the highest since June 2022. Following the release of US CPI data, spot gold briefly dipped by nearly $9 before a slight rebound, reaching a high of $1916.50 per ounce. Gold had been on a continuous decline since the beginning of the week, primarily due to investor caution regarding inflation data, the performance of the US economy, and the monetary policy of the Federal Reserve. Investors were more inclined to hold assets such as the US dollar. These factors led to a cautious retracement in the price of gold. Gold traders refrained from making new bets ahead of the crucial US CPI data set to be released on Wednesday. Given the non-yielding nature of gold, this upcoming CPI report has the potential to trigger explosive levels of volatility. Looking at the price movement, recent gold prices seem to lack a clear direction, with decreasing volatility. Gold prices have been hovering around the technical resistance zone of $1930 - $1938, which is also the convergence point of the 50-day simple moving average and a short-term downtrend line extending from the May high.
The daily gold chart indicates a downside bias in the price trend. Gold is trading below all of its short-term moving averages, including the 20-day (at $1917.80), 50-day (at $1931.60), and 100-day (at $1948.00) moving averages. The RSI (Relative Strength Index) technical indicator has gained downward momentum, crossing below the 50 midline into negative territory. Gold found a rebound point near the low of the week at $1907.40, which corresponds to the 23.6% Fibonacci retracement level of the decline from $1982.10 to $1884.70. Over the next few trading days, gold may continue its descent. If it breaks below $1900 (a psychological level), it could accelerate its decline to the $1884.90 level (the low from August 21st). On the other hand, if gold manages to move back above the 200-day moving average at $1921.60, it could encourage bullish momentum to target $1930.70 (the high of the week) and $1940 (a resistance trendline originating from the downward extension of the high from July 20th, 1987).
Today, it may be considered to short gold near $1913, with a stop loss at $1917, and targets at $1905 and $1903.

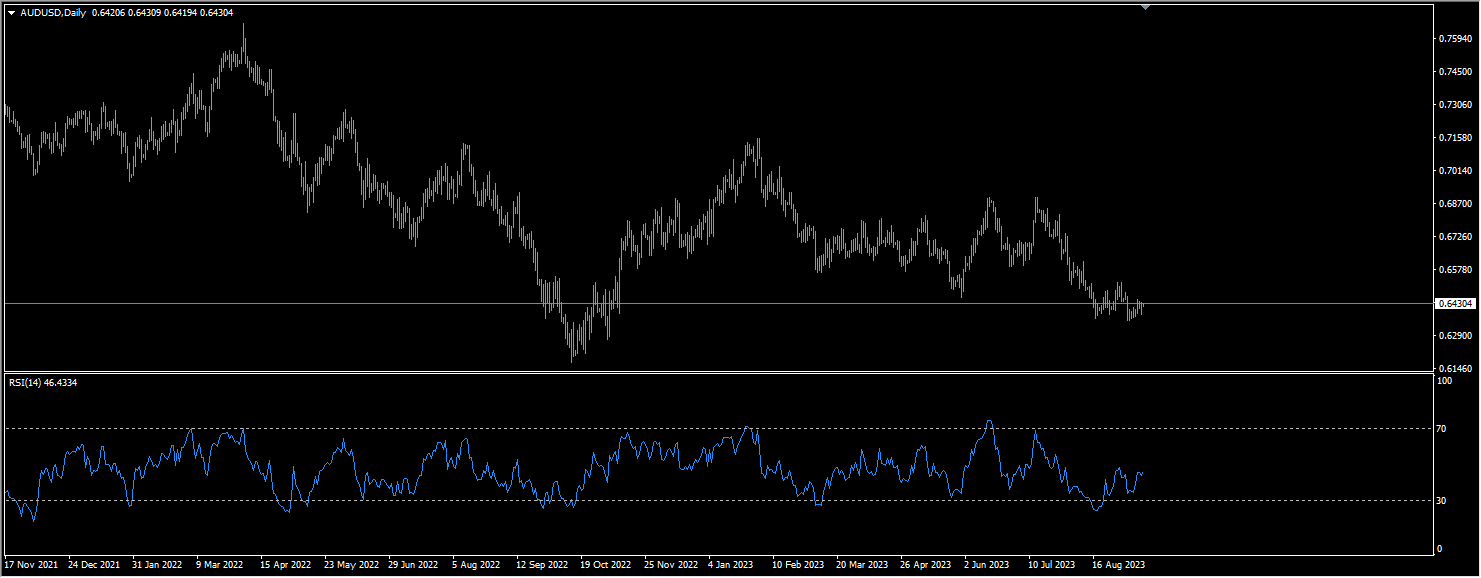
AUDUSD
In the early part of this week, the AUD/USD pair has shown a somewhat stable performance, although it hasn't managed to consolidate the gains from the beginning of the week. The market has been primarily driven by risk-off sentiment and moderate strength in the US dollar. However, it appears that the AUD/USD is forming a double bottom, which often signals exhaustion of selling pressure before a rebound. The market widely expects the Federal Reserve (Fed) to pause its rate hikes at the upcoming policy meeting next week, but there is still a possibility of rate hikes this year if the data indicates that economic and inflation cooling is not happening quickly enough. According to the CME's FedWatch tool, the expectation for the Fed to keep rates stable next week is at 93%, with around a 40% chance of a 25-basis-point rate hike at the November meeting. In addition to the consumer price data announced on Wednesday, investors will also be watching producer price and retail sales data on Thursday.
The AUD/USD pair fell to 0.6357 on September 5th, matching the low on September 6th, following a low of 0.6363 on August 17th. It then touched lows of 0.6362 and 0.6367 on September 7th and 8th, respectively. Therefore, it's worth noting that if the exchange rate does not clearly break below this range in the short term, and with technical indicators like RSI and stochastic oscillators rebounding from oversold levels, there is an inclination for the AUD/USD to stabilize in the short term. Looking at the daily chart, the current resistance is located at 0.6521 - 0.6522 (highs on August 30th and September 1st). If the AUD/USD can cleanly break through this barrier, it may trigger more upward momentum towards 0.6562 (38.2% Fibonacci retracement level of the rebound from 0.6895 to 0.6357), paving the way towards the psychological level of 0.7000. As for nearer-term support, refer to 0.6357 (previous low), and further support can be seen at 0.6272 (low on November 3rd, 2021) and the October 2022 low of 0.6170, with a critical reference at the psychological level of 0.6000.
Today, it may be considered to long the AUD near 0.6405, with a stop loss at 0.6380 and targets at 0.6475 and 0.6485.
GBPUSD
Boosted by favorable developments in non-US currencies, such as the Renminbi, the British pound to US dollar (GBP/USD) exchange rate saw a significant rebound correction opportunity. However, it turned out that the rebound in GBP/USD was short-lived. The latest employment report from the UK was mixed and did not provide the expected boost to GBP/USD, highlighting the current weakness in the trend. Additionally, hawkish comments from Bank of England officials failed to support the GBP/USD trend. Deputy Governor of the Bank of England, Dave Ramsden, stated on Tuesday that "there is an upside risk to inflation in August" and warned of the "risk of a second round of inflation," indicating that "a lot of tightening will be introduced." However, these hints of "high inflation" from the BoE Deputy Governor did not change the downward trend of GBP/USD during the trading session. Since recent movements in non-US currency exchange rates against the US dollar have been primarily driven by the strength or weakness of the US dollar, the outlook for GBP/USD this week may largely depend on the US CPI (Consumer Price Index) data for August. Considering that some leading indicators have already hinted at a potential rebound in US inflation in August, if the data confirms this expectation, or even shows a stronger-than-expected inflation rebound, the US dollar may continue to strengthen, potentially putting further pressure on GBP/USD.
The daily chart shows that GBP/USD briefly rebounded above 1.25 but proved to be short-lived. Failing to hold above 1.25 and resume its downward movement, the next target is towards the 200-day moving average at 1.2420. This level is an important support level to watch, as GBP/USD has been trading below the 200-day moving average since March 9th of this year. If the 200-day moving average is strongly supported in subsequent movements, there may be potential for a rebound correction rally. However, if the 200-day moving average is effectively breached, further declines could target levels like 1.2400 (a support trendline extending from the low on April 3rd at 1.2275) and 1.2300 (a psychological level). On the other hand, if there is a short-term rebound back above 1.2548 (this week's high), further upward movement may target resistance levels at 1.2607 (23.6% Fibonacci retracement level of the rebound from 1.3143 to 1.2446), 1.2617 (120-day moving average), and the next level at 1.2712 (38.2% Fibonacci retracement level).
Today, it is advisable to consider going long on the British pound near 1.2470, with a stop loss at 1.2440, and targets at 1.2550 and 1.2560.

USDJPY
Comments from the Governor of the Bank of Japan, Haruhiko Kuroda, have increased market expectations that the Bank of Japan may abandon its negative interest rate policy. However, on Tuesday, influential ruling party member and Secretary-General of the Liberal Democratic Party in the Senate, Hiroshi Shigefumi, expressed his preference for an ultra-loose monetary policy. As of now, the Bank of Japan still remains an outlier among central banks globally, and even if it abandons its negative interest rate policy, the reality is that interest rate differentials will remain significant. The trend towards carry trades is unlikely to dissipate easily. Intraday, US inflation data is set to be released, and if the data remains robust, it will increase bets on potential future rate hikes, which would not be favorable for the Japanese yen. Since the USD/JPY pair broke above the 145 level, which was a warning line for the Bank of Japan's intervention last year, traders have been concerned about when the Bank of Japan might intervene. Therefore, it is essential to remain cautious and guard against knee-jerk overreactions due to potential Bank of Japan intervention.
From a technical standpoint, if the USD/JPY exchange rate moves higher, be watchful of resistance in the range of 147.85-148.40, while on the downside, support can be found in the range of 145.90-145.50. Technical indicators such as RSI and stochastic oscillators have already started to decline, and the MACD indicator has crossed below the signal line again, indicating the need to be cautious about potential downside risks for the USD/JPY pair. Current support levels to watch for include 146.10 (lower boundary of the ascending channel), the 30-day moving average at 145.63, and then the 38.2% Fibonacci retracement level at 144.11 (from 138.05 to 147.87). As for current resistance levels, attention should be given to 147.87 (previous high), which restricted upward movement last week. Further resistance is expected at 148.80 (upper boundary of the ascending channel) and the psychological level of 150.
Today, it is advisable to consider going short on the USD near 147.75, with a stop loss at 148.10, and targets at 146.30 and 146.20.

EURUSD
For the September ECB (European Central Bank) interest rate meeting, it is expected that the ECB will keep interest rates unchanged. However, the ECB may accompany this decision with hawkish comments and potentially use a reduction in the balance sheet as a supplement. If this happens, it may temporarily stabilize the Euro. Ahead of the ECB meeting on Thursday, investors will be waiting for the US Consumer Price Index (CPI) inflation data to be released on Wednesday. While inflation data is unlikely to shake the expectation that the Federal Reserve will maintain interest rates in its policy statement next week, strong data could increase expectations for further rate hikes in upcoming meetings. In that case, the Euro would still face downside pressure.
This week, the Euro appears to be undergoing a consolidative rebound, but the strength is limited. On the daily chart, the 20-day (1.0802) and 200-day (1.0826) moving averages have formed a "death cross," indicating a bearish trend bias that has not changed. It is essential to continue guarding against the risk of the Euro being sold at higher levels. From a technical perspective, the descending trendline formed since the July high at 1.1275 is currently around the 1.0825 level, and the 200-day moving average is also positioned at a similar level, at 1.0826. If the exchange rate can break above this area in the near future, it would provide more confirmation that the EUR/USD exchange rate can stabilize again. The next target could be seen at 1.0883 (76.4% Fibonacci retracement level of the rebound from 1.0945 to 1.0686). As for downside support, it can be found at 1.0686 (low on September 7th) and the critical 1.0676 level (250-day moving average), which would point toward the 1.05 level, a support level the Euro held in February and March of this year.
Today, it is advisable to consider going long on the Euro near 1.0700, with a stop loss at 1.0675, and targets at 1.0755 and 1.0775.

Disclaimer:
The information contained herein (1) is proprietary to BCR and/or its content providers; (2) may not be copied or distributed; (3) is not warranted to be accurate, complete or timely; and, (4) does not constitute advice or a recommendation by BCR or its content providers in respect of the investment in financial instruments. Neither BCR or its content providers are responsible for any damages or losses arising from any use of this information. Past performance is no guarantee of future results.
More Coverage


Risk Disclosure:Derivatives are traded over-the-counter on margin, which means they carry a high level of risk and there is a possibility you could lose all of your investment. These products are not suitable for all investors. Please ensure you fully understand the risks and carefully consider your financial situation and trading experience before trading. Seek independent financial advice if necessary before opening an account with BCR.
Jurisdiction Notice:Our services are not intended for residents of the United States & Canada, and we do not intend to distribute or use the provided information in any country or jurisdiction where it would be contrary to local law or regulation. It is important that you read and consider the relevant legal documents associated with your account, including the Terms and Conditions issued by BCR before you start trading. BCR Co Pty Ltd is regulated by the British Virgin Islands Financial Services Commission, Certificate No. SIBA/L/19/1122. The Registration Number in the BVI is 1975046. The Registered Address of the Company is Trident Chambers, Wickham’s Cay 1, Road Town, Tortola, British Virgin Islands.

 English
 简体中文
简体中文
 繁體中文
繁體中文
 Bahasa
Melayu
Bahasa
Melayu
 Tiếng
Việt
Tiếng
Việt
 ไทย
ไทย
 日本語
日本語
 한국어
한국어
 ភាសាខ្មែរ
 español