


0
US Dollar Index
On Thursday, the US dollar remained stable, with the US dollar index hovering around 103.50 as traders digested the latest Consumer Price Index (CPI) data. The February inflation report showed that inflation slowed in February, with both monthly and annual figures lower than expected. Monthly headline inflation registered at 0.2%, down from 0.5% in January, while core inflation fell to 0.2%, lower than the expected 0.3%. Both headline and core figures slowed faster than expected, reinforcing expectations of easing pre-US tariff pressures imposed recently. US President Donald Trump is also speaking out, and the market is evaluating his remarks. The US dollar index temporarily escaped from a multi-day deep sell-off and retested the 103.80 area, accompanied by rising yields. In the end, the dollar managed to regain some stability and achieved acceptable gains after a multi-month low. However, the overall situation is still affected by intense tariff uncertainty and concerns about a US recession.
From the daily chart, the US dollar index remains under pressure, remaining near a multi-month low around 103.50. Technical indicators 14-day relative strength index (RSI) and moving average convergence divergence (MACD) show oversold conditions, prompting traders to pause aggressive selling. Despite the recent decline, a break below 103.23 {Tuesday's low}, and 103.00 {market psychological level} may open up further room for decline and further point to 102.52 (76.4% Fibonacci retracement level of 100.16 to 110.18). A rebound above 104.00 (round number level), and 104.05 (8-day simple moving average) may trigger a short-term rebound attempt. The next level will challenge the 10-day simple moving average at 104.66.
Consider shorting the US dollar index around 103.73 today, stop loss: 103.88, target: 103.30, 103.20

WTI spot crude oil
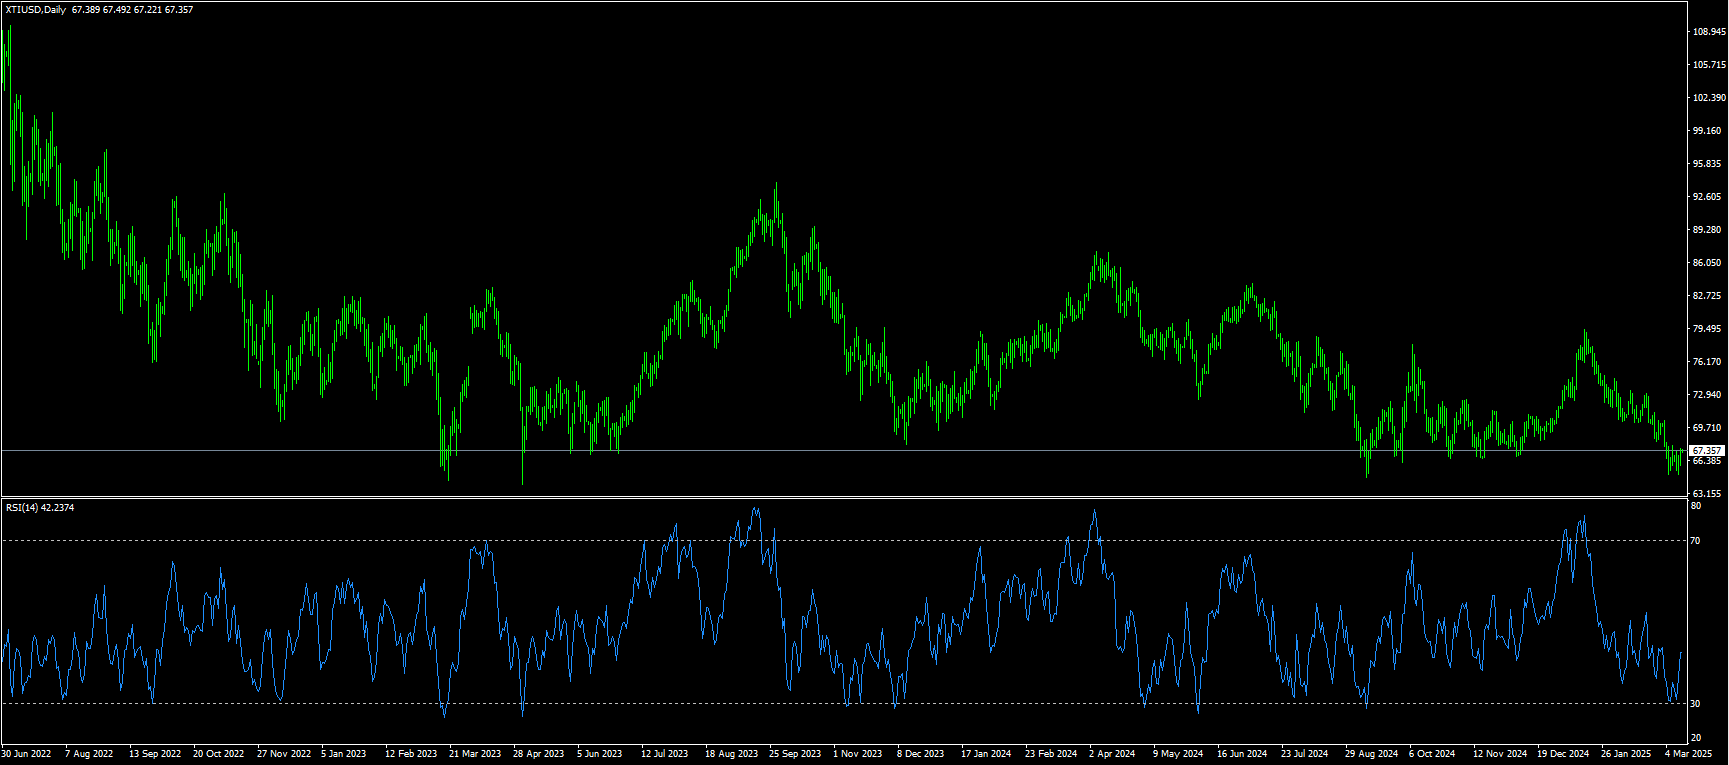
WTI crude oil was trading at $67.40 in early Asian trading on Thursday. WTI prices extended their rebound due to tight crude oil inventories. However, the upside of WTI prices may be limited due to growing concerns about a slowdown in the US economy and the impact of tariffs on global economic growth. Crude oil inventories rose last week. This week, the increase in crude oil was smaller than expected, which indicates strong demand, which may lead to higher oil prices. Nevertheless, US President Donald Trump's aggressive tariffs on imported goods are expected to push up corporate costs, increase inflation, and weaken consumer confidence, thus dealing a blow to economic growth. This in turn may drag down WTI prices. The White House confirmed on Tuesday that new 25% tariffs on all imported steel and aluminum will take effect on Wednesday, including tariffs on allies and major US suppliers Canada and Mexico.
Crude oil prices benefit from short-term dollar weakness, but remain vulnerable to economic headwinds and policy uncertainty. A decisive breakout above $67.86 (14-day moving average), and $67.94 (March 7 high), could push oil prices toward $70.00 (market psychological barrier), but continued upward movement would require stronger demand signals or unexpected supply disruptions. The 14-day relative strength index (RSI) of the daily chart is still in the negative zone (near 41.00), indicating that the short-term trend is still weak. WTI crude oil is neutral in the range of $65.88 per barrel (Wednesday low) to $66.71 (5-day moving average), and a breakout of this range may provide a direction for future trends. Oil prices may indicate a continuation of the downward trend to the $65.05 {March 11 low) level.
Today, you can consider going long on crude oil near 67.20, stop loss: 67.00; target: 68.50; 68.70
Spot gold
In early Asian trading on Thursday, spot gold fluctuated narrowly at a two-week high and is currently trading around $2,940/ounce. As the US consumer price growth slowed in February, the Federal Reserve is expected to resume interest rate cuts in June, and Europe took retaliatory actions after Trump began to impose metal tariffs. Safe-haven demand once again provided momentum for gold prices to rise, helping gold prices rise by nearly $20 on Wednesday, reaching an intraday high of $2,940.30/ounce, slightly lower than the historical high of $2,956.30. Recent changes in the structure of holdings reveal institutional trends. According to the latest CFTC report, fund managers' net long positions in gold increased by 7,842 lots to 143,205 lots in the week ending March 5, marking the fourth consecutive week of increases. However, it is worth noting that commercial short positions increased by 4.2% simultaneously, indicating that spot traders' hedging demand increased. This simultaneous increase in long and short positions usually indicates that a major market is about to start.
From the daily chart, the upward channel formed by gold prices since March 5 remains intact, but the volatility shows a gradually narrowing feature. The current price is running above $2,930 (small double tops on March 5 and 7). The momentum indicator shows a divergence signal, and although the 14-day relative strength index (RSI) remains above 60, the MACD column continues to narrow, and the two lines tend to stick together, suggesting that the market is about to choose a direction to break through. In terms of key support, the $2,900 integer mark superimposed on the 21-day moving average of $2,913 forms a double defense. This position has been tested three times in the past five trading days and has effectively stopped falling. If it breaks down unexpectedly, the $2,880 area (February 26 low) will provide secondary support. On the upside, special attention needs to be paid to the effectiveness of the breakthrough of the previous historical resistance range of $2,956.30, which is a technical barrier to the historical high of $2,956 on February 24, 2025. It is followed by the market-recognized psychological level of $3,000.
Today, you can consider going long on gold before 2,930.00, stop loss: 2,926.00; target: 2,950.00; 2.955.00

AUD/USD
AUD/USD continues to rise, breaking through the 0.6300 mark, despite a good rebound in the US dollar, and opens the door to testing the monthly high of 0.6360 in the short term. On the other hand, it is affected by broad risk aversion. Concerns have intensified due to policy changes by US President Trump, especially the possibility of raising tariffs, which increases the possibility of a long-term trade war. In addition, Trump described the economy as being in a "transition period", suggesting a possible slowdown. Investors see his remarks as an early signal of possible economic turmoil in the future. The Australian dollar is also under pressure from economic uncertainty and persistent deflationary risks from China, its largest trading partner, as traders await key policy announcements from Beijing. Market participants remain focused on the Reserve Bank of Australia's policy outlook, especially after strong economic data last week reduced expectations of further rate cuts. Economic growth exceeded expectations, marking the first acceleration in more than a year. Comments from the central bank will be minimal this week as the Fed enters a dark period before its March 19 meeting.
On Wednesday, AUD/USD traded around 0.6300, and technical analysis on the daily chart shows that the pair remains below its 100-day moving average of 0.6354, suggesting weakening short-term momentum. In addition, the 14-day relative strength index (RSI) of the technical indicator is slightly below its 50-day moving average of 0.6269, further reinforcing the bearish bias. On the downside, AUD/USD may first test the 50-day moving average hovering around 0.6269. Then 0.6234 (last Wednesday's low), breaking which will look towards the 0.6200 round mark. On the other hand, AUD/USD is testing the early week high of 0.6331, followed by the 100-day moving average of 0.6354. A break above this level could strengthen short-term momentum and push the pair towards the three-month high of 0.6409 last reached on February 21.
Consider going long AUD before 0.6305 today, stop loss: 0.6290; target: 0.6340; 0.6350.

GBP/USD
General optimism in the risk-related space, coupled with uncertainty in the US dollar price, has pushed GBP/USD higher, shifting attention back to the 1.3000 threshold. GBP/USD slipped slightly during Wednesday's Asian session, giving up some of the gains from the previous day's strong rise to a four-month high of around 1.2966. Spot prices are currently trading around 1.2960, and despite the lack of bearish conviction in the downside, traders are eagerly awaiting the release of US consumer inflation data before placing new directional bets. Meanwhile, some repositioning trades helped the dollar recover some of the losses it suffered the previous day as it fell to its lowest level since mid-October and acted as resistance for the pair. However, any meaningful appreciation of the dollar seems elusive amid growing acceptance that the Federal Reserve will cut interest rates multiple times this year, amid concerns over a tariff-driven slowdown in US economic activity. Apart from this, the market expects the BoE to cut interest rates at a slower pace than other central banks, including the Fed, which could support the British pound and provide support for the GBP/USD pair.
Even from a technical perspective, last week’s sustained break above the very important 200-day simple moving average (1.2789) was seen as a key trigger for the bulls and suggests that the path of least resistance for the pair is to the upside. Hence, any further corrective slide could still be seen as a buying opportunity and more likely to remain limited. GBP/USD is testing a second consecutive weekly gain, approaching an 18-week high of 1.2990. Further bullish gains could be limited by key psychological levels of 1.2990 (Wednesday’s high), and 1.3000. The next level is 1.3048 (high since November last year). Currently, the momentum is completely in the hands of buyers, but technical oscillators have been in overbought areas since January, and a quick reversal may happen soon. Therefore, the support below can focus on 1.2835 (9-day simple moving average), and then the 200-day simple moving average at 1.2789.
Today, it is recommended to go long on GBP before 1.2950, stop loss: 1.2940, target: 1.2990, 1.3000

USD/JPY
USD/JPY once soared to above 149.00 as the US dollar rose after weak US inflation data in February. Cooling US inflation is expected to boost the Fed's dovish bets. Although Japanese companies agreed to further wage increases, the yen performed poorly. In the early European trading session on Wednesday, the recovering dollar remained weak before 148.80, despite the lack of follow-up support under the hawkish Bank of Japan expectations. Data released earlier showed that Japan's annual wholesale inflation - Producer Price Index (PPI) rose 4.0% in February, highlighting the intensification of inflationary pressures. This further supports the market's growing acceptance that the Bank of Japan will raise interest rates further. In addition, the sharp narrowing of the interest rate differential between Japan and other countries should provide support to the low-yielding yen and help limit losses. Moreover, given the market's bets that the Federal Reserve will cut interest rates multiple times this year, as well as concerns about the tariff-driven slowdown in US economic activity and signs of a cooling US labor market, any significant dollar appreciation seems elusive and limits the rise of USD/JPY.
From a technical perspective, the oscillator on the daily chart is deeply trapped in the negative zone and is still far from entering the oversold zone. This in turn suggests that the path of least resistance for USD/JPY is to the downside and any further gains may still be limited around the breakout point of the horizontal support of 148.80-148.70. However, if there is some follow-up buying that leads to a subsequent breakout of the 149.00 mark, it could trigger a short-term covering rally towards the intermediate resistance of 149.70-149.75 and eventually towards the psychological level of 150.00. On the other hand, the 147.25 area now seems to act as an immediate support ahead of the 147.00 round mark and the 146.55-146.50 area (i.e. the multi-month lows hit on Tuesday). If the latter is broken, USD/JPY may accelerate its decline towards the 146.00 round mark.
Today, it is recommended to short the US dollar before 148.55, stop loss: 148.75; target: 147.50, 147.30

EUR/USD
After the European session on Wednesday, EUR/USD traded in a neutral tone, hovering around 1.0900, with market participants adopting a wait-and-see attitude after the strong rebound. The pair appears to be consolidating as bulls hesitate near recent highs, lacking strong momentum to push further. Later, during Wednesday’s North American session, EUR/USD corrected to near 1.0890 following the release of the U.S. Consumer Price Index (CPI) report for February, which showed inflationary pressures growing at a slower-than-expected pace. The major pair fell as the dollar strengthened despite the slower-than-expected increase in U.S. inflation, which is expected to boost market expectations of a rate cut by the Federal Reserve at its May policy meeting. The dollar has underperformed over the past few weeks as President Trump’s tariff agenda dampened economic outlook. Market participants expect Trump’s “America First” policies to drive inflationary pressures, ultimately eroding the purchasing power of households already facing high inflation.
From a technical perspective, the relative strength index (RSI) remains in overbought territory but has begun to flatten, suggesting a pause in buying pressure. Meanwhile, the moving average convergence/divergence (MACD) continues to show green bars, suggesting that the overall bullish trend remains intact. However, the lack of immediate follow-through from buyers suggests that further gains may not be imminent. Focus on key levels, initial resistance is at 1.0930, and a break above this level could open the door to 1.0980. On the downside, initial support is around 1.0850, followed by the psychological level of 1.0800. The 200-day simple moving average around 1.0750 may attract stronger buying interest.
Today, it is recommended to go long on the euro before 1.0875, stop loss: 1.0865, target: 1.0930, 1.0940.

Disclaimer: The information contained herein (1) is proprietary to BCR and/or its content providers; (2) may not be copied or distributed; (3) is not warranted to be accurate, complete or timely; and, (4) does not constitute advice or a recommendation by BCR or its content providers in respect of the investment in financial instruments. Neither BCR or its content providers are responsible for any damages or losses arising from any use of this information. Past performance is no guarantee of future results.
More Coverage


Risk Disclosure:Derivatives are traded over-the-counter on margin, which means they carry a high level of risk and there is a possibility you could lose all of your investment. These products are not suitable for all investors. Please ensure you fully understand the risks and carefully consider your financial situation and trading experience before trading. Seek independent financial advice if necessary before opening an account with BCR.
Jurisdiction Notice:Our services are not intended for residents of the United States & Canada, and we do not intend to distribute or use the provided information in any country or jurisdiction where it would be contrary to local law or regulation. It is important that you read and consider the relevant legal documents associated with your account, including the Terms and Conditions issued by BCR before you start trading. BCR Co Pty Ltd is regulated by the British Virgin Islands Financial Services Commission, Certificate No. SIBA/L/19/1122. The Registration Number in the BVI is 1975046. The Registered Address of the Company is Trident Chambers, Wickham’s Cay 1, Road Town, Tortola, British Virgin Islands.

 English
 简体中文
简体中文
 繁體中文
繁體中文
 Bahasa
Melayu
Bahasa
Melayu
 Tiếng
Việt
Tiếng
Việt
 ไทย
ไทย
 日本語
日本語
 한국어
한국어
 ភាសាខ្មែរ
 español